Cartwheeling in CamMotion
by Scott Bresnahan, Ted Ducas, and Andee Rubin
Hands On! Volume 17, No. 2, Fall 1994 (c) TERC, 1994. All rights reserved.
To many students, mathematics has only tenuous connections to their everyday lives and personal concerns. In recognition of this, current educational reform emphasizes that teachers should adopt curriculum activities that “connect mathematics to students’ lives.” But what kinds of activities might these be? How can students’ concerns be effectively integrated into mathematics instruction?
The VIEW project at TERC is developing a new combination of video and computer technologies to bring math and students together in ways previously impossible. With the resulting tool, students can explore and analyze their own experiences by making measurements of real phenomena recorded on videos. Video allows them to slow down or speed up time; associated computer software lets them analyze events they enact or observe. For example, by making measurements on single frames of video, students can explore the “fine structure” of actions that take place quickly, like bouncing balls or flying paper airplanes. They can examine patterns of motion through video analysis of their own bodies in activities such as sports and dance.
The innovation that makes this vision possible is called CamMotionTM. The project team is designing CamMotion with the goal of using measurement to mediate between students’ activities and mathematical representations and meaning. Through the process of measuring and recording, real experiences on video are turned into numbers that can be examined, manipulated, and graphed. This process parallels what happens with TERC’s microcomputer-based labs (MBL), in which probes attached to the computer record and measure variables such as motion, light, temperature, and ozone in the air. Seeing its parallels with MBL, the designers refer to CamMotion as a video-based lab, or VBL.
The easiest way to see the potential of CamMotion is to work through a simple example.
Imagine two seventh graders, Kathy and Nadia, who are on the school playground practicing gymnastics. Kathy observes Nadia doing several flawless cartwheels and says, “Nadia, you’re amazing. You do the most terrific cartwheels, but you don’t look strong enough to support your weight on one hand.” Nadia looks a bit confused. Kathy continues, “I mean, at some time during each cartwheel, you must have all your weight on one hand while your feet are in the air, right?”
Nadia pauses a moment to think, then says, “I don’t think so…I sure can’t do a one-handed handstand. But now that you mention it, I wonder what happens exactly. I’ve just been ‘doing’ cartwheels – not ‘thinking’ about them. Let’s check it out with CamMotion.”
First Kathy uses a camcorder to videotape Nadia doing cartwheels in the school auditorium. They connect the camcorder to a computer and play back the tape. The images are captured and digitized by the computer into a machine-readable movie that can be displayed on the computer screen. Next Nadia and Kathy are ready to explore how Nadia does a cartwheel.
To begin an investigation with CamMotion, students choose a digitized movie and decide what information they are interested in collecting. To analyze the cartwheel, Kathy and Nadia track the positions of Nadia’s right and left hands. They decide to start with her right hand. While advancing through the frames of the movie, Kathy and Nadia click on Nadia’s right hand in each picture to mark its position. Figure 1 shows the screen they see while in the process of collecting these data. Notice the cross hairs on Nadia’s right hand, where she and Kathy have placed them to indicate the position of the hand in this frame. Clicking on this spot causes CamMotion to store the current time in the movie and the position of this point in (x,y) coordinates, and to display both data entries in the table at the bottom of the screen.
In addition to position data, CamMotion supports measurements of distance, angle, area, and count, among others. Just as position data are used to track an object’s motion over time, distance data measure the distance between two objects over time, such as two runners in a race. Angle data can track the rotation of objects, such as a figure skater spinning or a hamster’s wheel turning, or examine the angle of a diver’s body or an athlete’s leg in a long jump.
Of course, the process of mapping the real world to coordinates on the screen is not always straight-forward. Like any robust measuring system, CamMotion has a set of tools that facilitate connecting the observed world to mathematical representations. Accessed through several buttons (see left side of Figure 1), these tools allow Nadia and Kathy to set the origin, establish reference points, and change the scale of the coordinate system.
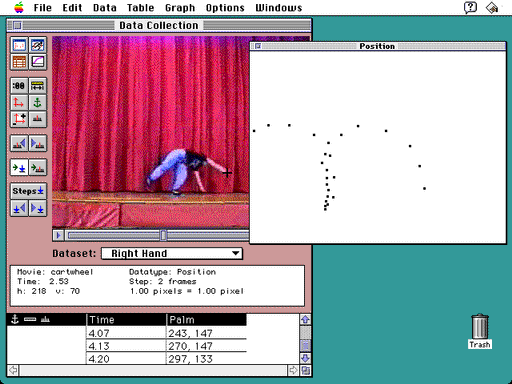
Figure 1. Data Collection Process
A Student captured on video spins through a cartwheel while CamMotionTM software displays the trace of her right hand. The time and the horizontal and vertical positions of each point are displayed in the bottom table.
By default, the origin of the coordinate system on the screen is the lower left corner, effectively below the level of the stage on which Nadia is doing her cartwheel. If Kathy and Nadia want to change this so that the origin connects more usefully to the images they are studying, they can specify a different origin, such as the level on the stage at which Nadia’s hands touch the floor.
In all but a few cases, the size of an image on the screen will be significantly different from the size of the object in the real world. But Kathy and Nadia are interested in knowing how far Nadia’s hand moves in real life, not on the video. To set an appropriate scale, they need to indicate on the video a length that reflects an actual size, then enter that length as a scale factor. In examining the cartwheel, the girls use Nadia’s arm, which they know is half a meter, as their calibration length. This same feature can be used to compensate for any changes in distance between the subject and the camera because of zooming or the subject moving. By using a sequence of scale factors, CamMotion can always make the appropriate conversions.
Some events take place over such a distance that the camera must pan to capture the full range of motion. A reference point tool allows students to seamlessly make adjustments for such camera movement by tracking an object that is always in the video frame, although the object appears at different locations in different frames. For example, such adjustments could be made to the video from a camera moving to follow the ball in a tennis game, using the net as a reference point.
In addition, Kathy and Nadia can control the number of frames the movie advances after each data point is collected. If they see frames that they think are particularly interesting, they can specify these with a bookmark and return to them later.
During the data collection process, Kathy and Nadia can see, in a separate window, a trail of the points they have already collected. They can see that the pattern of Nadia’s hand is just beginning to repeat (see Figure 1). They can also see that the motion of her hand near the floor is complex and difficult to decipher from this graph because they are unable to determine the order of the points. To get a clearer idea, they can choose one of two options. They can replay the movie at any point and watch the trail be replotted, echoing the movie. Or they can ask to see a graph of either horizontal or vertical component of the hand’s position versus time.
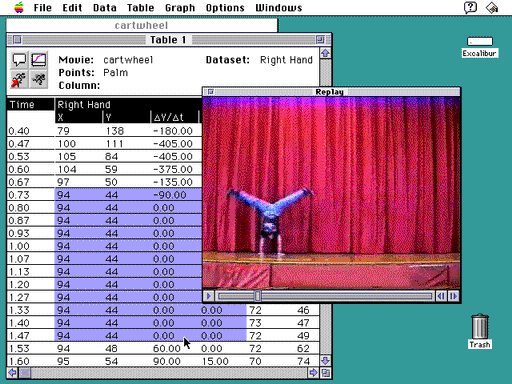
After Kathy and Nadia collect their samples, they can display their data as either a table or a graph. As shown in Figure 2, they have chosen first to activate the table window to view their data in a spreadsheet, with each row representing measurements at a specific time. They can create columns that are derived from their collected data using manipulations such as difference, summation, velocity, and acceleration.
In looking at the table Kathy and Nadia notice something strange: eleven rows with the very same data. They wonder if they might have made a mistake during data collection, or if a sequence of frames in the video really generated these data. What can this mean? Kathy and Nadia select these rows (see Figure 2) and request that the corresponding video frames be played in the replay window. They notice that the selected piece of video shows Nadia upside-down with both hands on the floor. Now they understand that these numbers are not errors; Nadia’s right hand did not move during this half second.
Kathy and Nadia are now eager to look at the motion of Nadia’s left hand to continue their exploration of Kathy’s hypothesis: that at some point in doing her cartwheels Nadia has only one hand (and no feet!) on the floor. They go through a similar process to collect data on Nadia’s left hand, then build a graph combining the two data sets so that they can compare the motion of her two hands.
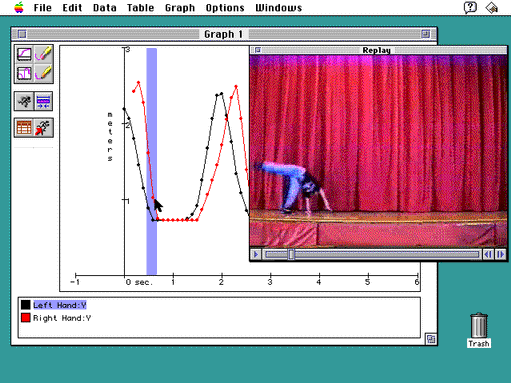
A line graph shows that the cartwheeler’s left hand lands first, followed quickly by her right hand. To investigate the motion at this critical juncture, students can replay the video by clicking and dragging directly on the graph.
Figure 3 illustrates the graph that shows the motion of Nadia’s right and left hands. Does this graph help Kathy confirm her hypothesis? As the girls examine it, Kathy says, “Look, Nadia, there’s a small piece of the graph where you have only one hand on the floor!” As indicated by the arrow, a single data point shows where Nadia’s left hand is on the floor and her right hand is off. Or at least, that’s how the graph appears. But what part of the cartwheel corresponds to this part of the graph? One of CamMotion’s most powerful features allows Kathy to follow up her curiosity by selecting a portion of the graph and clicking a replay button to view those frames of the video.
After selecting the graph segment and replaying the corresponding frames, Nadia concurs, “Look, in this frame my left hand is on the floor, and my left foot is about to come off the floor. But just before my foot leaves the floor, I bring my right hand down. So, I am never actually touching the floor with only one hand when both my feet are off the floor. I think I see what’s happening. Let’s go through the images again. My right hand comes down very quickly to the floor, then my legs go over with both hands stationary on the floor. Hmm…I wonder how fast my hands and feet are going?”
To review the frames where Nadia’s legs are moving while her hands are in one place, the girls play the video by sweeping the mouse over the graph where the horizontal line indicates that both hands are on the floor. They can see the graph-to-video correspondence at the pace of the moving mouse, slowly or quickly, depending on the amount of detail they want.
Observation, hypothesis, and experimentation may lead Kathy and Nadia to ponder other questions about the cartwheel. Are her feet and hands always the same distance apart? Is there any part of her body that stays the same vertical distance from the floor during the entire cartwheel? What are the form characteristics needed to do a flawless cartwheel? With CamMotion, the fleeting seconds that it takes Nadia to do a cartwheel can be stilled and the questions that her movement raises can be answered.
CamMotion’s strength comes from the ease with which students can collect different types of data, create multiple representations of data, and set up an active link from tables and graphs to original video. Students understand more easily what a data table or graph means when they can associate a particular sequence or shape with real-world activities captured on video. Students can use CamMotion with prerecorded video, but, as Kathy and Nadia demonstrate, its effect is enhanced when students themselves record the phenomena they analyze.
The VIEW project aims to produce a tool and associated curriculum that can help forge strong connections between students’ lives and mathematics. Imagine a classroom in which students always have a video camera available to capture motions that fascinate them, where they can see mathematics in the patterns and activities around them, where they can understand the mathematics of a situation through tables or graphs. CamMotion brings such a classroom closer to this reality.