Temperature: Connecting Math, Science, and Social Studies in Grade 5
Excursions are freely available sequences of related activities that encourage students to apply the mathematics they are learning to their own and others’ lives and communities. They were developed by the Forum for Equity in Elementary Mathematics to foster authentic connections between the mathematics students are learning in school and their experiences at home and in their communities. This blog illustrates the principles of Excursions, laid out in the introductory blog, in the context of a specific Excursion. It is the second in a series that will share the experience and work of field test teachers and students engaging in each of the published Excursions.
Fifth graders are often interested in extremes. Where in the World Is It Hot? Where Is It Cold? is a data excursion that explores extremes of temperatures, the expedition in search of the North Pole, and temperatures over time in places students’ families have lived or visited. The work focuses on plotting and understanding the meaning of points on a coordinate grid, interpreting the shape of a graph and the story it tells, and making sense of average temperatures and particular temperatures like 0 and negative numbers.
When students encounter “Mystery Graphs” showing average temperatures in two different places over the course of the year, they are intrigued to think about the possible locations. Take a moment to look at the graph. What do you notice? What do you wonder? What places might be represented by the red and blue lines on this graph?

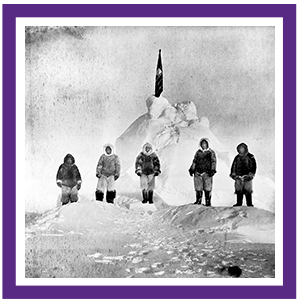
In one field test classroom, students guessed that the blue line represented Russia, Alaska, and Antarctica. Upon learning that the Mystery Graph represents the average temperatures at the North and South Poles, many were shocked that they would be so different. When they learned about Matthew Henson, a member of Robert Peary’s 1908 expedition to the North Pole, they noticed how the temperatures in Henson’s log (i.e. all negative numbers) compared to the ones in Mystery Graph 1.
As they encounter Mystery Graphs, including another showing extremely hot temperatures (Death Valley, CA), students are reading graphs and making sense of the story the data is telling. This prepares them to graph the average monthly temperature of a place in the world that is important or interesting to them, or someone in their family or community. Field test teachers commented on the way this activity supported students in making connections between math and their lives and interests.
“It was a fun way to talk about this type of math. It was a different kind of mathematical thinking, less computational. You’re telling the story of the data, and that engages different math learners in a meaningful and productive way. For example, I have a student who does not like to compute, but storytelling and writing and literature is something that he loves. When he got to write about the data, and write about his experience, he was engaged with the math in a way that he hasn’t typically been.” – Cooper, Field Test Teacher
“Sometimes I find math to be more challenging to connect to home, more so than social studies or ELA, and this idea of talking to somebody about a place that either you’ve lived or that someone in your family has lived really created this connection to their home life. A lot of them came in saying, I talked to my grandmother and she told me a million stories about this place. They were definitely really engaged and wanting to share what they learned, and I learned a lot from them.” – Melissa, Field Test Teacher
Thinking back on the Excursion as a whole, the teachers reflected:
“It was a really great way to get kids that don’t normally participate, to participate. A lot of these kids that had really cool places that their families were from, and really wanted to share that information and they’re not kids that always feel comfortable doing those math talks and sharing about their math. This is a great way to give them that confidence and that little boost of like “This is math and you’re good at it and you can do this!” – Melissa, Field Test Teacher
“What I think made this activity really great is its accessibility. There’s a student in my class, she’s a beginning English language learner who’s been here since the end of January. We are not a sheltered English inclusion class and I do not speak Spanish, so it’s been a struggle to engage her. This activity engaged her because she got to talk and write about Baní. I know that’s where she’s from, but I don’t know much about Baní and the Dominican Republic. But she loves it and she misses it, and I really appreciated that I was able to do this work with her. She was able to be a part of this activity in ways that she hasn’t really been able to and that was really cool. And actually, she learned that the young girl that sits next to her, who is also Dominican, is also from Baní, and they had this whole moment together and they’ve been working together on this project, which is really cool. And it wouldn’t happened if we didn’t have this context to work in.” – Cooper, Field Test Teacher
What we heard from teachers who field tested the Temperature Excursion, and other Excursions across the grades, echoed the goals laid out in the introductory blog. The mathematics was accessible, deep, and rich. Students were more engaged and exhibited persistence. More children contributed to whole class discussions, expanding the voices heard in the classroom. Teachers learned more about students and their families, and students learned more about each other. Look for future blogs, which will take up these same themes in the context of other Excursions.
Resources
1. (ca. 1908) Matthew Henson (center) and four Inuit guides (Ooqeah, Ootah, Egingwah, and Seeglo) stand at the North Pole in this photo taken by Robert Peary. [Photograph] Robert E. Peary, Wikimedia Commons. Public Domain. Retrieved from https://www.nationalgeographic.com/adventure/article/160224-polar-explorer-matthew-henson-photos.