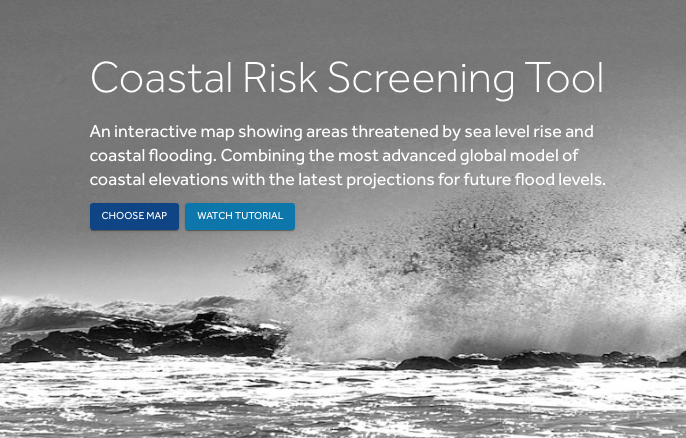
The Coastal Risk Screening Tool interactive website (site also available in Spanish) offers a range of map-based simulations based on climate models that show how sea level rise and flooding could affect coastal areas around the world. By clicking on the “choose map” button, students can choose to view areas at risk by year, water level, temperature, the melting of ice sheets, and more. There is even a map that shows specifically how affordable housing in different communities will be affected by sea level rise.
Within each map, there is at least one slider allowing students to change a parameter and see the effects on the map. For example, students can adjust sliders to compare areas below the tideline in different global warming scenarios (in the “Warming Choices” map) or view projections for years from 2030 to 2100 (in the “Year” map). Additional settings are available in many maps and include parameters like “pollution pathways” and “luck.” (Hover over the small “i” next to each choice for an explanation of what it means in the current context.) Students can access these additional settings by clicking “change other settings” on any map.
Also, every map includes a button labeled “details and limitations” that gives background information on the map, including definitions of important vocabulary terms. The map can show any area that Google Maps can show, so students can investigate the impacts in their local area or other areas in the world that are important to them.
The following video is a tutorial on how to use the tool.
This tool can be used in lessons on climate change, geography, or social justice. In a math class, this resource could be tied in to lessons on:
- Units of length and conversions between metric and standard systems (in the context of making sense of sea level rise)
- Units of temperature (degrees Celsius and degrees Fahrenheit)
- Probability and modeling (e.g., What is likely to happen under particular conditions? What does it mean for something to be likely or unlikely? How can scientists predict the future?)
- Area and benchmark fractions and percents (e.g., About what percent of Boston will be under water in 2050 if pollution continues unchecked?)
Some other activities and resources that could be connected with this tool include:
- Understanding Risk— This lesson looks at risk and probability in the context of health decisions. Discussions can compare the risks and potential benefits of medical interventions to the risks and potential benefits of climate interventions (including, in both cases, the risks associated with not doing anything).
- EMPower: Over, Around, and Within, Lesson 8 (Conversion Experiences)— Students make sense of standard length units and convert between them.
- EMPower: Using Benchmarks, Lesson 4 (Fraction Stations)— Students compare fractions found in real world objects to benchmarks ½, ¼, and ¾.
- A Degree of Change: Exploring Global Climate Change — Resource collection
- CALM Unit 16: Analyzing Data with Climate Change— By the end of this unit, students will be able to apply their understanding of measures of central tendency and variation by using data to write a convincing response to an argument about climate change. Students will explore measures of central tendency and compare data sets by comparing measures of central tendency and using box plots. (Note: CALM units are only available to teachers who have attended a CALM Orientation or the CALM Introduction online course.)