Will This Be on the Test? (January 2023)
by Sarah Lonberg-Lew
Welcome to the latest installment of our monthly series, “Will This Be on the Test?” Each month, we’ll feature a new question similar to something adult learners might see on a high school equivalency test and a discussion of how one might go about tackling the problem conceptually.
Welcome back to our continuing exploration of how to bring real conceptual reasoning to questions students might encounter on a standardized test. One year ago, we met Alicia who works in an appliance store and earns a commission on sales. Let’s check back in and see how she’s doing. Here is this month’s problem:
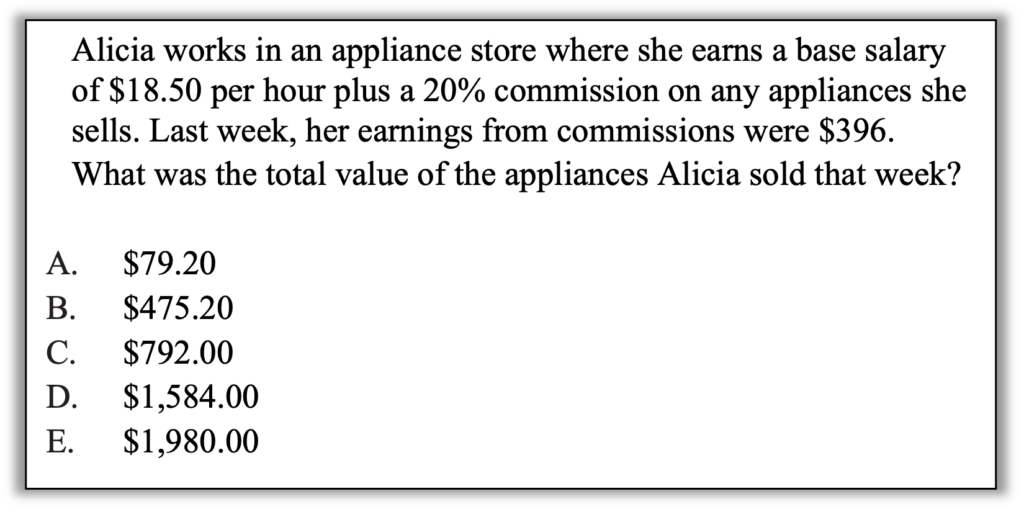

How can you approach this question in a way that makes sense to you? What conceptual understandings or visual tools can you bring to bear? What mathematical concepts do students really need to be able to tackle this problem? How might your real-world experience help you reason about this? (Maybe you know a procedure or a trick for finding the answer. Can you think of any other approaches?)
While many students struggle to make sense of problems involving percents, it is also a topic that students are almost always eager to learn about. In my experience, there are two reasons for this. One is that percents regularly come up in adult life in a variety of contexts, and reasoning with them is an essential numeracy skill. People who do not have the skills to reason about percents may use apps designed to do the solving for them in situations that require those skills. The other reason is that learning about percents has often been stressful and confusing for students because it has involved learning different procedures for different kinds of problems—procedures that require identifying part, whole, and percent and then remembering what you are supposed to do with those numbers.
However, by taking time to make sense of a problem, estimate, and draw pictures, students can navigate a range of percent situations without ever memorizing procedures.
Here are some possible approaches:
1. Estimate—Attend to precision. Estimation is almost always a good starting point. It helps students make sense of the situation and avoid panicked number-grabbing. In this case, coming up with an estimate for the total sales will get students thinking about how that number relates to the numbers given in the problem. If Alicia earned $396 from commissions, does that mean the total amount of her sales was more or less than $396? Which would make sense? This will help a student understand what they have and what they are looking for. Do they need to find 20% of $396? That would be less than $396, so that wouldn’t make sense as the total amount of sales. It must be that $396 is 20% and they need to find the number that $396 is 20% of. That number must be bigger than $396. How much bigger? A little or a lot?
Note: Figuring out and paying attention to what each number in a scenario represents (e.g., $396 is 20% of something and I need to figure out the something) is part of attending to precision – Standard for Mathematical Practice #6. Making it a norm to communicate clearly in your classroom about what the numbers you are using mean will help students develop this important mathematical habit of mind and carry it through to the test and even to real world problem solving.
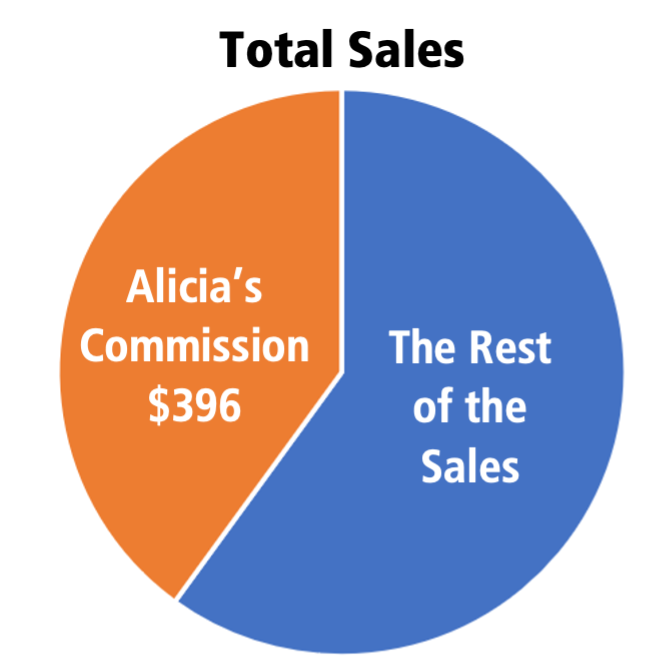
2. Estimate with a picture—Use benchmarks. What does 20% look like to you? A common representation of percents is a circle graph (or pie chart). Depending on what benchmarks a student is comfortable with, they might represent 20% as less than half…
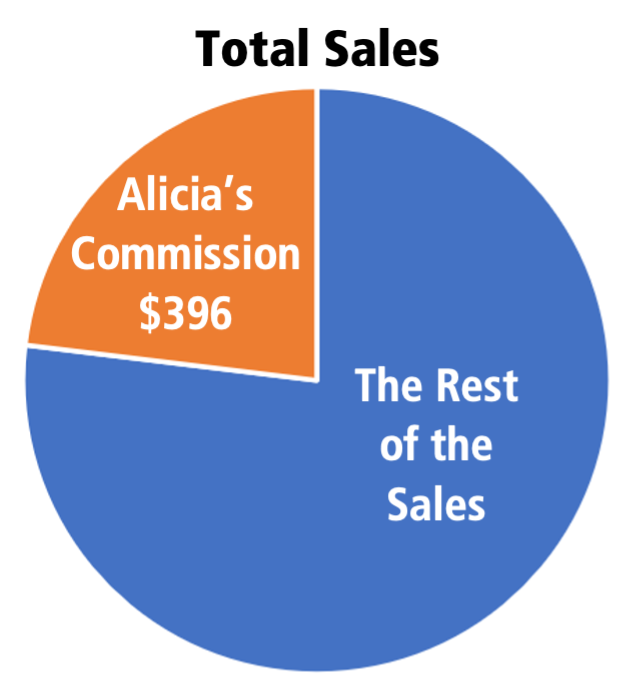
or as less than one-quarter…
or even more precisely, as exactly one-fifth.
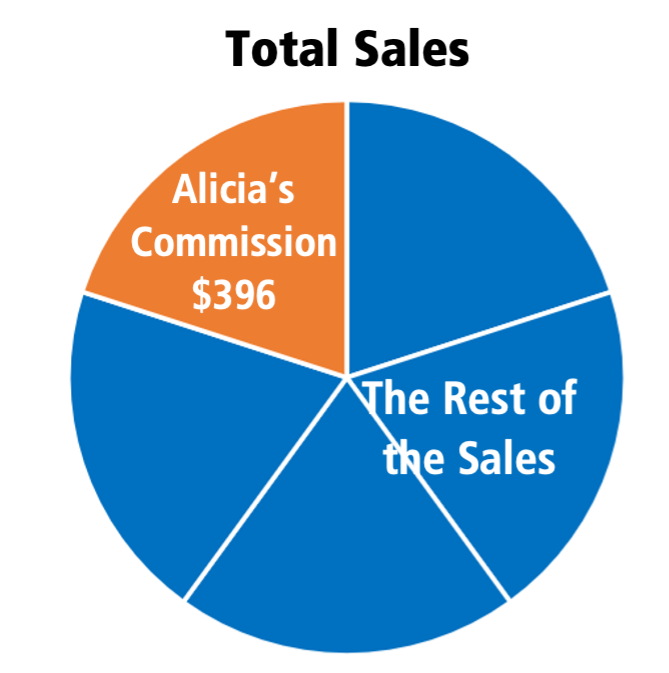
How might these pictures help a student estimate the total sales? (Note: A student who uses benchmark 50% to estimate what the whole is when 20% is known is not wrong. Having more precise benchmarks will enable students to make better estimates, but students have to work with the benchmarks they know … and continue to grow their repertoire.)
3. Reason with a bar model—Use benchmarks. A student who is familiar with the equivalence of 20% and 1/5 might draw a bar model like this:

whereas a student who doesn’t have 20% in their set of benchmarks might think in chunks of 10% or 1/10 instead:
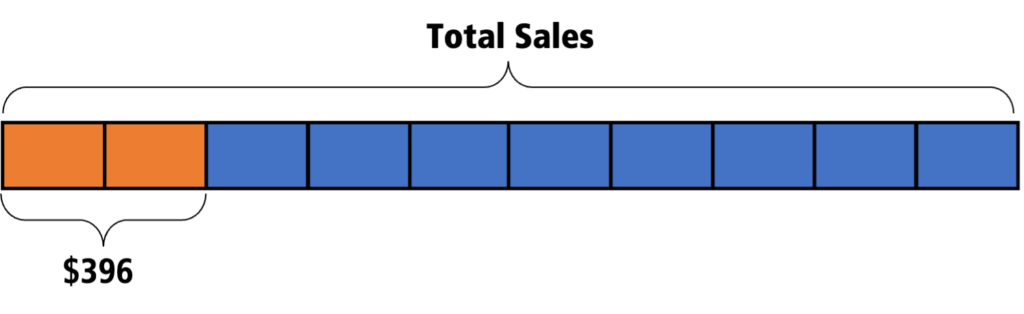
How might these pictures help a student figure out the total sales?
Attending to precision and visualizing the situation in a way that makes clear what the part is, what the whole is, and what you are looking for is a powerful and flexible way of reasoning. It provides a way into any kind of percent task without having to figure out which procedure you are “supposed to” use and then having to remember how to use it.
And, it even works when the percents you’re dealing with are less friendly. See our blog How I Learned to Stop Worrying and Love Percents for an example. And check out our packet Modeling Benchmark Percents and Fractions and for some more examples of using bar models to reason about percent problems.

Sarah Lonberg-Lew has been teaching and tutoring math in one form or another since college. She has worked with students ranging in age from 7 to 70, but currently focuses on adult basic education and high school equivalency. Sarah’s work with the SABES Mathematics and Adult Numeracy Curriculum & Instruction PD Center at TERC includes developing and facilitating trainings and assisting programs with curriculum development. She is the treasurer for the Adult Numeracy Network.