Will This Be on the Test? (March 2024)
by Sarah Lonberg-Lew
Welcome to the latest installment of our monthly series, “Will This Be on the Test?” Each month, we’ll feature a new question similar to something adult learners might see on a high school equivalency test and a discussion of how one might go about tackling the problem conceptually.
Welcome back to our continuing exploration of how to bring real conceptual reasoning to questions students might encounter on a standardized test. Last month we looked at finding the mean of data given in a frequency table. This month, we’ll revisit that data with another measure of central tendency:
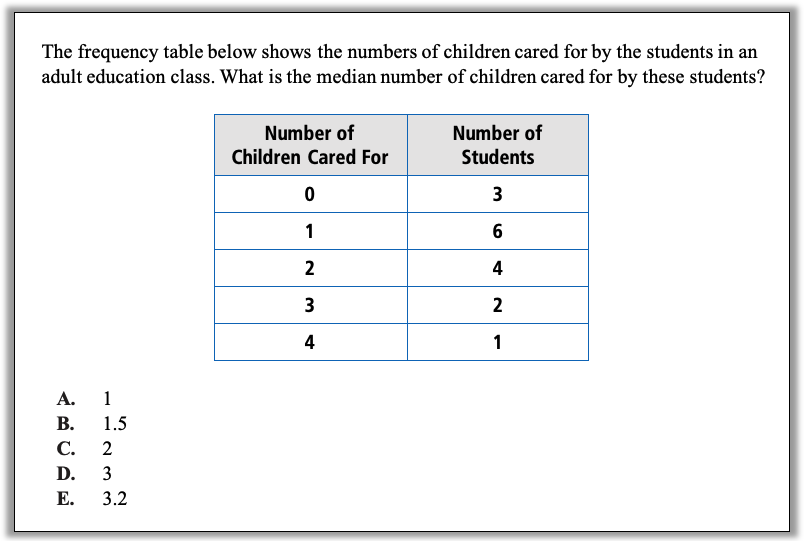

How can you approach this question in a way that makes sense to you? What conceptual understandings or visual tools can you bring to bear? What mathematical concepts do students really need to be able to tackle this problem? How might your real-world experience help you reason about this?
In last month’s column, we talked about how to make sense of a frequency table if you have never seen one before and we looked at some strategies for reasoning about the mean of the data. This month, we are considering the median of the data. When I was in school, I learned to find the median by listing the data in numerical order and crossing off numbers from each end of the list until only one or two were left in the middle. I knew how to find a median, but I did not have any sense of what a median actual meant. Having some conceptual understanding about the median makes a difference when the task doesn’t look exactly like the one procedure I was taught.
Here are some strategies for reasoning about the median, given that a student has been able to make sense of the question (see strategy 1 from last month.)
1. Think about reasonableness. One key understanding about the median is that it is the point that divides the data set into two pieces that each have the same number of data points in them. Could the median of this data set be 0? Only 3 students care for 0 children, so a lot more care for 1 or more. Could the median be 4? Only 1 student cares for 4 children, so a lot more care for fewer than 4. Could the median be 3? What number or numbers look like they could be the median, with half the students caring for that many children or more and half caring for that many or fewer? (And why, having made sense of the table, does it not make sense to find the median of the numbers in either column of the table?)
2. Write the data out the long way. Students should be empowered to redisplay data in a way that makes sense to them, both in math class and in life. It may be that recreating the raw data set is the thing that makes it most accessible to a student. A student might read the table and recreate the data like this:
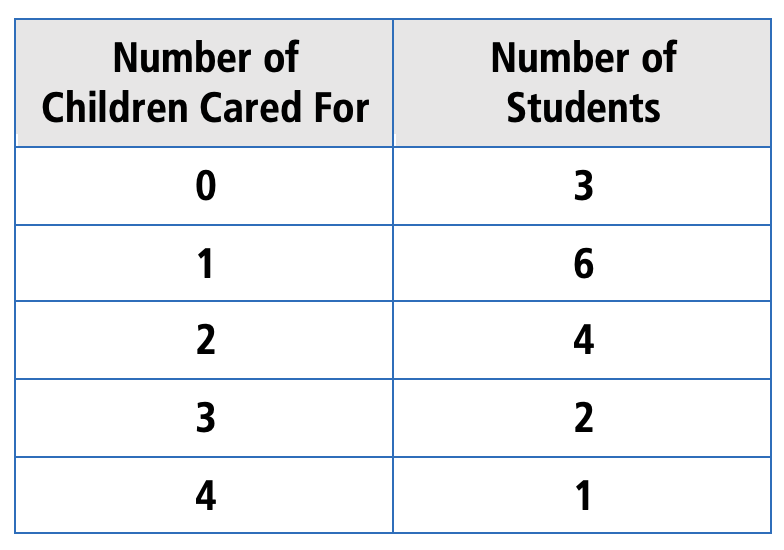
The first row tells me that the number of students who care for 0 children is 3, so my data set starts with
0, 0, 0
The second row tells me that the number of students who care for 1 child is 6, so my data set includes:
1, 1, 1, 1, 1, 1
Continuing in this way, the student could write out the whole data set in order and find the median by identifying the middle of the list.
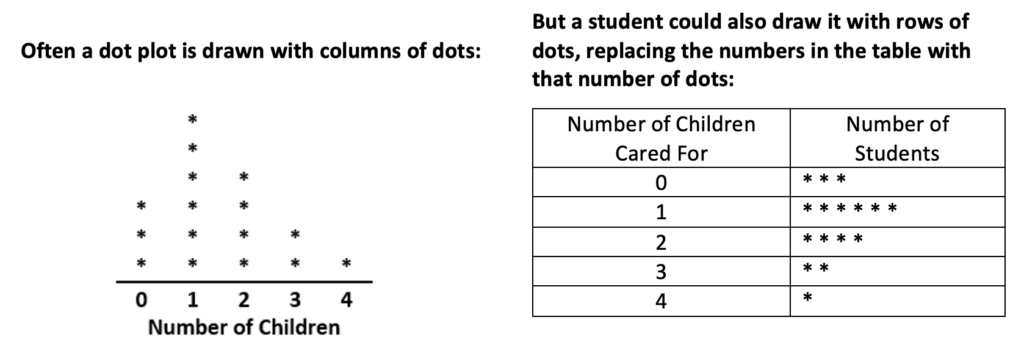
3. Visualize with a different data display. A frequency table is a concise way to display data, but it can be hard to get a good sense of the data from it. A student might choose a different way to display the data that could help them identify the median more easily – for example a student might draw a dot plot of the data with the number of dots in each column being the number of students who care for that many children.
In these plots the students in the class are represented by the dots in the dot plot. Now it is clearer how many students are in the class – one for each dot. Since there are 16 dots and therefore 16 students, a student could draw loops to show dividing the data into two equal groups of 8, grouping the higher numbers together and the lower numbers together:
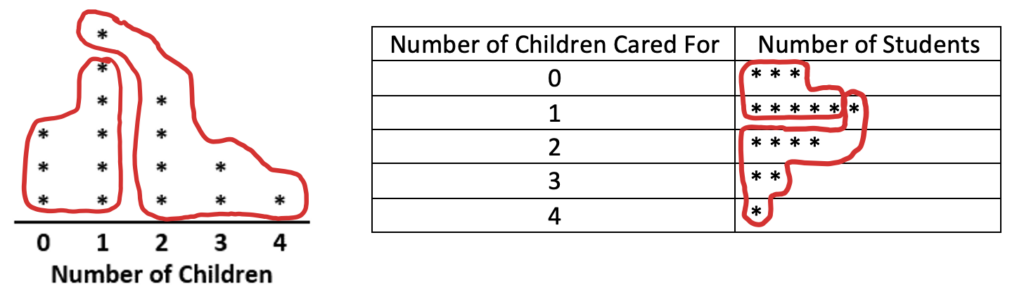
How do these groupings show the median of the data?
This question and last month’s could be good for Test Talks at the beginning of a lesson on frequency tables because they will give students a chance to try to make sense of a data display they haven’t seen before. You might give them a little push, if needed, by encouraging them to think about how this data display could be providing them with data that answers the question, how many children does each student care for? Giving students 10-20 minutes to make sense of the data and apply a strategy for finding the mean or median before you teach about frequency tables will prime them to understand how they work whether or not they manage to make sense of them on their own. Even if a student does not succeed in making sense on their own, they will still benefit from time spent trying.

Sarah Lonberg-Lew has been teaching and tutoring math in one form or another since college. She has worked with students ranging in age from 7 to 70, but currently focuses on adult basic education and high school equivalency. Sarah’s work with the SABES Mathematics and Adult Numeracy Curriculum & Instruction PD Center at TERC includes developing and facilitating trainings and assisting programs with curriculum development. She is the treasurer for the Adult Numeracy Network.