Will This Be on the Test? (February 2024)
by Sarah Lonberg-Lew
Welcome to the latest installment of our monthly series, “Will This Be on the Test?” Each month, we’ll feature a new question similar to something adult learners might see on a high school equivalency test and a discussion of how one might go about tackling the problem conceptually.
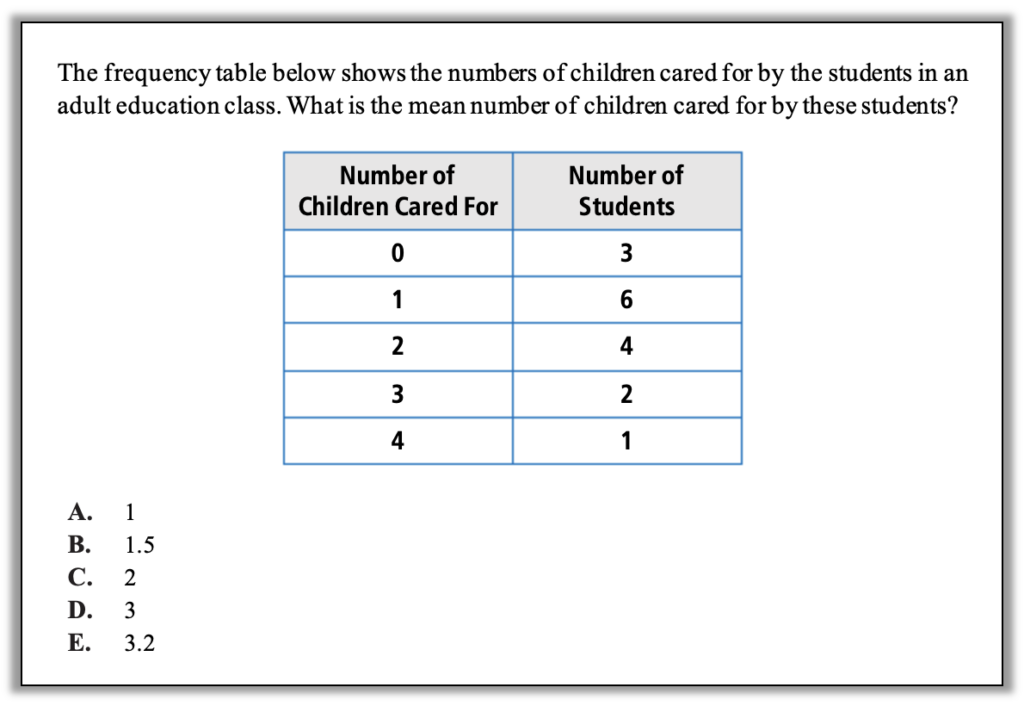
Welcome back to our continuing exploration of how to bring real conceptual reasoning to questions students might encounter on a standardized test. This month, let’s look at a question from the data domain:

How can you approach this question in a way that makes sense to you? What conceptual understandings or visual tools can you bring to bear? What mathematical concepts do students really need to be able to tackle this problem? How might your real-world experience help you reason about this?
This question deals with a frequency table, which is a kind of data display that students may not have seen before because it doesn’t always come up in lessons on ways of displaying data. However, students who have developed the confidence and capacity to make sense of new and unfamiliar things may still have a chance to make sense of this. Read on to see how.
Here are some possible approaches. As with all problem solving, it is important to start with making sense of the question.
1. Make sense of the question. Suppose you have never seen a frequency table before. Suppose you are not even sure what frequency means. Can you still make sense of this table? Take a deep breath and read the information carefully. The text of the question tells you something about what to expect in the table. This table should give you some information about how many children each student in the class cares for, but it doesn’t look at first glance like a table that gives that information. A student might be expecting something more like this:
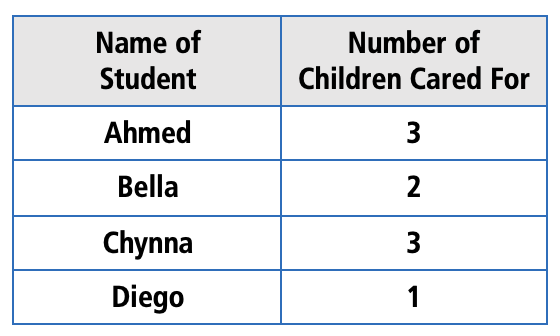
But this table looks different. For one thing, the Number of Children Cared For is in the left column, and for another, the individual students are not named. Since this is a new and different kind of data display, a good question to ask is, How is this giving me the information I expect from it? Look at a single row in the table:
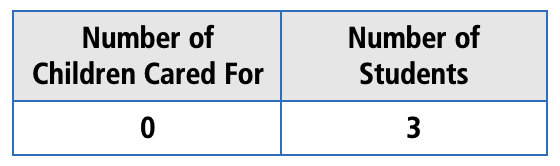
How does this start to answer the question of how many children each student in a class cares for?
Once a student figures out how to read the table, the task of finding the mean becomes possible.
It’s important to note that while making sense is an important first step in any problem solving, it doesn’t always work out. A student in a test situation who tries to figure out how this table works and can’t make sense of it should just make a guess on this question and move on to something else.
2. Estimate! Assuming a student understands that the table tells us that there are 3 students who care for 0 children, there are 6 students who care for 1 child, there are 4 students who care for 2 children, etc., how might they estimate the mean number of children cared for? Here are some noticings about the data that might help:
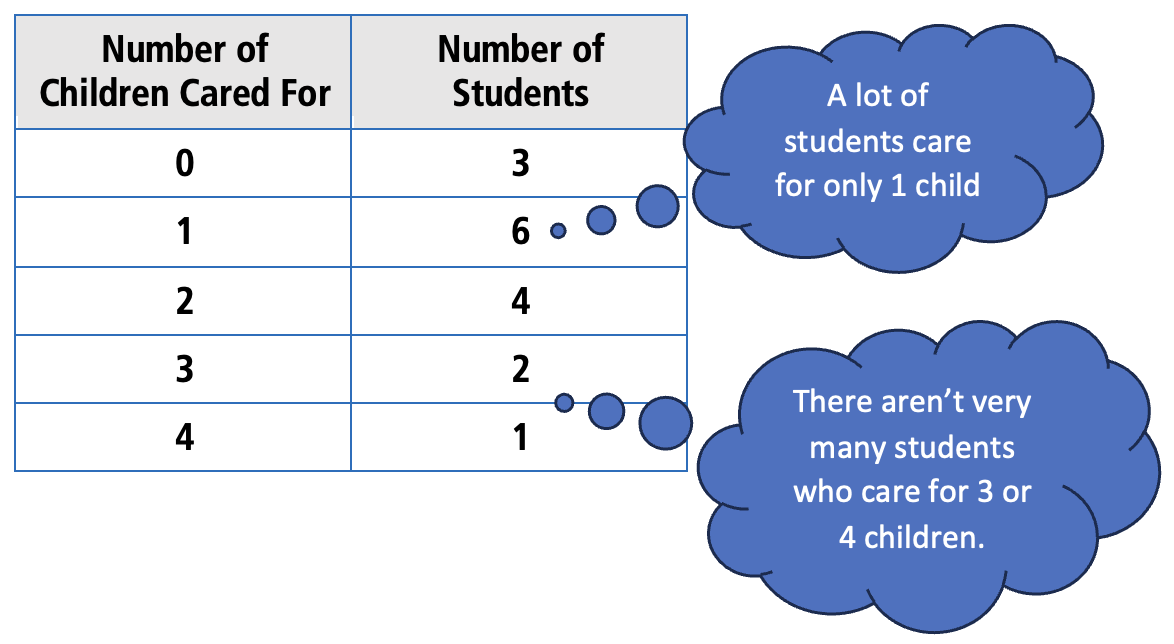
What else might a student notice about the data that could help with estimating the mean? Which of the answer choices seem like they could be the mean?
3. Visualize the data a different way. A student who thinks more concretely might want a visual that feels more connected to the context than the frequency table. For example, they might start drawing out the students and their children like this:
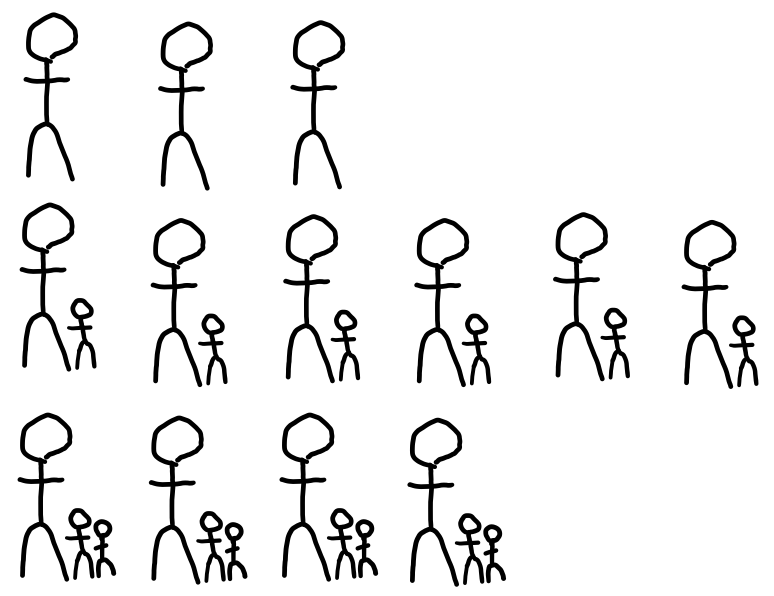
… and so on. If you are thinking that this approach will take too long, know that students don’t spend precious time drawing unhelpful pictures. A student who draws out pictures like this a few times will likely come to realize that they can visualize the data in more abstract ways that are quicker to draw without losing the substantial benefit of being able to see the data. For example, a student who is ready to visualize more abstractly might draw something like this:
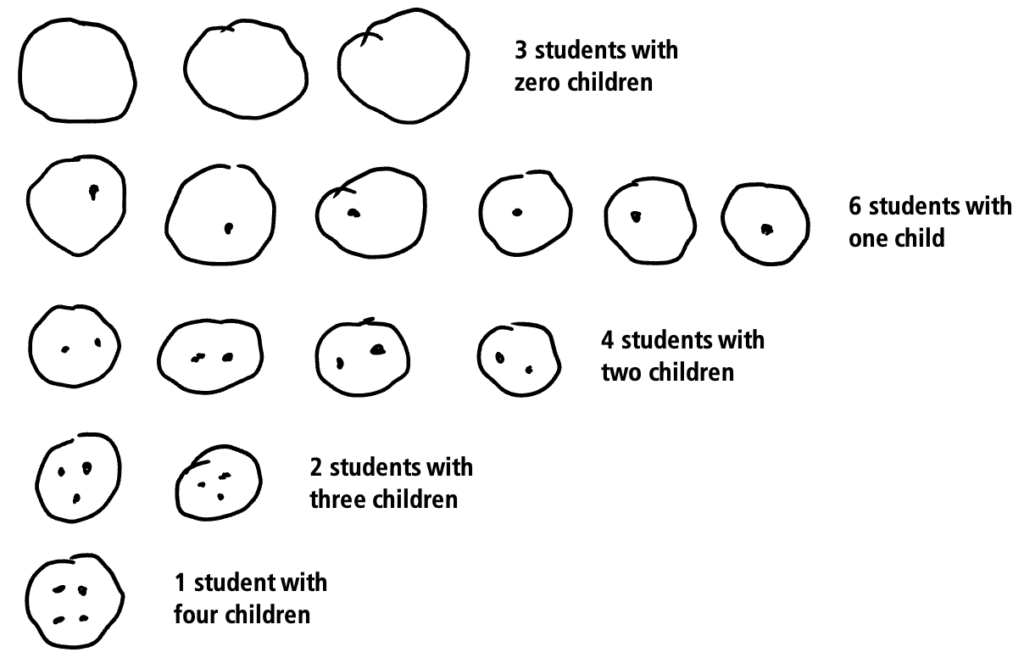
One helpful way of thinking about the mean is to imagine redistributing the children so that every student cares for the same number of children. That number is the mean. Are there enough dots (children) to put one dot in each circle? Are there enough to put 2? This representation shows both the total number of children cared for and the total number of students in the class. If you are not sure how this gives you what you need to find the mean, consider what you do in the traditional procedure for finding the mean. Where in that procedure do you encounter the total number of children cared for? How in that procedure do you use the total number of students? (For more on visualizing and thinking conceptually about means, see the February 2022 installment of Will This Be on the Test?)
Frequency tables express data concisely, but they can be confusing if we don’t take time to make sense of how they are presenting the data. Building fluency and comfort with multiple ways of representing data will empower students to create their own representations that make the data most accessible to them.
Next month, we’ll revisit this same data and think about the median. What strategies and representations do you think will be helpful for finding the median? Stay tuned!

Sarah Lonberg-Lew has been teaching and tutoring math in one form or another since college. She has worked with students ranging in age from 7 to 70, but currently focuses on adult basic education and high school equivalency. Sarah’s work with the SABES Mathematics and Adult Numeracy Curriculum & Instruction PD Center at TERC includes developing and facilitating trainings and assisting programs with curriculum development. She is the treasurer for the Adult Numeracy Network.