Will This Be on the Test? (Feb 2022)
by Sarah Lonberg-Lew
Welcome to the latest installment of our monthly series, “Will This Be on the Test?” Each month, we’ll feature a new question similar to something adult learners might see on a high school equivalency test and a discussion of how one might go about tackling the problem conceptually.
Welcome back to our continuing exploration of how to bring real conceptual reasoning to questions students might encounter on a high school equivalency test. This month let’s revisit the data domain with a question type found in many a textbook and test:
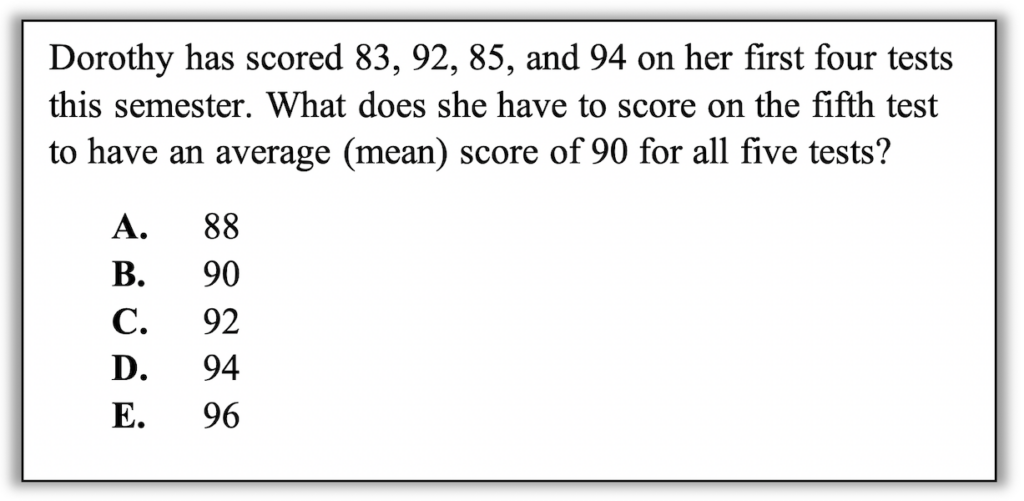

Pause to reflect. How would you approach a problem like this? What understandings about means can you bring to bear on this problem? What visuals can you use to think about means?
In helping students prepare for tests, I have walked many of them through some variation on this question where the mean is given and one piece of data is missing. Initially, I thought the one and only way to solve this was by writing an equation using the standard procedure for finding a mean (add ‘em up and divide) and solving for x. If you’ve been keeping up with this blog, you should know by now that there are always multiple entry points into a problem. Let’s dig into some of them. As you read through them, consider what meanings and models of means are being used. There may be some ways of thinking about means here that you haven’t thought of before!
1. Estimate. Estimation is almost always a good entry point into a problem that has a “real world” context and into many problems that don’t. In this case, a student who knows that the mean is a way of identifying a “middle” of a set of numbers might start by informally evaluating what Dorothy’s current mean score is. She has two scores that are below 90 and two scores that are above 90, but the scores that are below are further away from 90 than the scores that are above. This probably means her current mean score is less than 90, so she probably needs a score that is greater than 90 to hit the target.
2. Think about distances from the target mean. One way to think about the mean as the middle of the set is that it is like a balance point with the same amount of deviation from it on either side. On a number line, this could look like this:
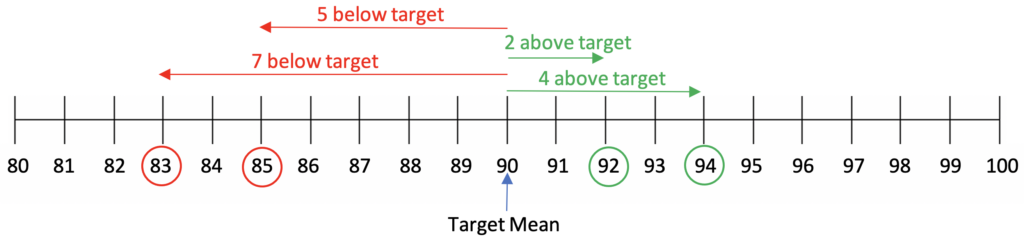
Looking at this diagram, a student can see that the arrows below the target mean have a greater total than those above. What arrow could be added to the number line so that the total less than the target is equal to the total greater than it? What score would that represent?
This reasoning could also be done in a table using signed numbers to denote the distances above and below the target:
| Score | Distance from target mean (90) |
|---|---|
| 83 | -7 |
| 92 | +2 |
| 85 | -5 |
| 94 | +4 |
| ??? | ??? |
For 90 to be the mean of the set, the total of all the differences must be 0. What fifth score would make that true?
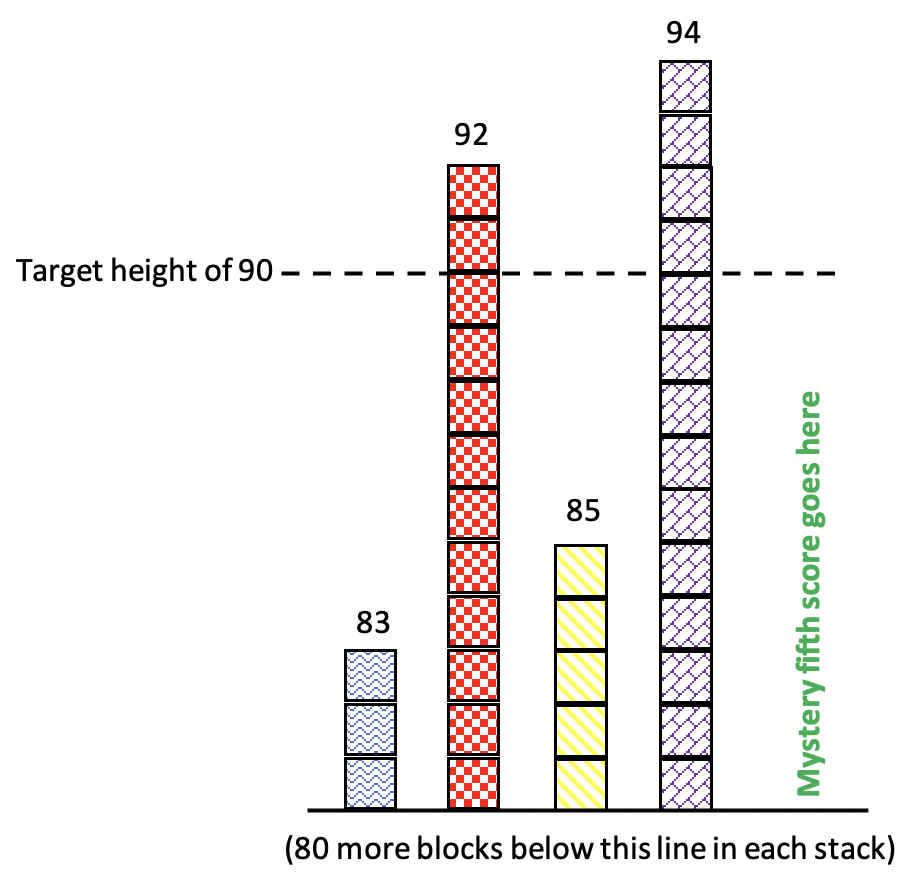
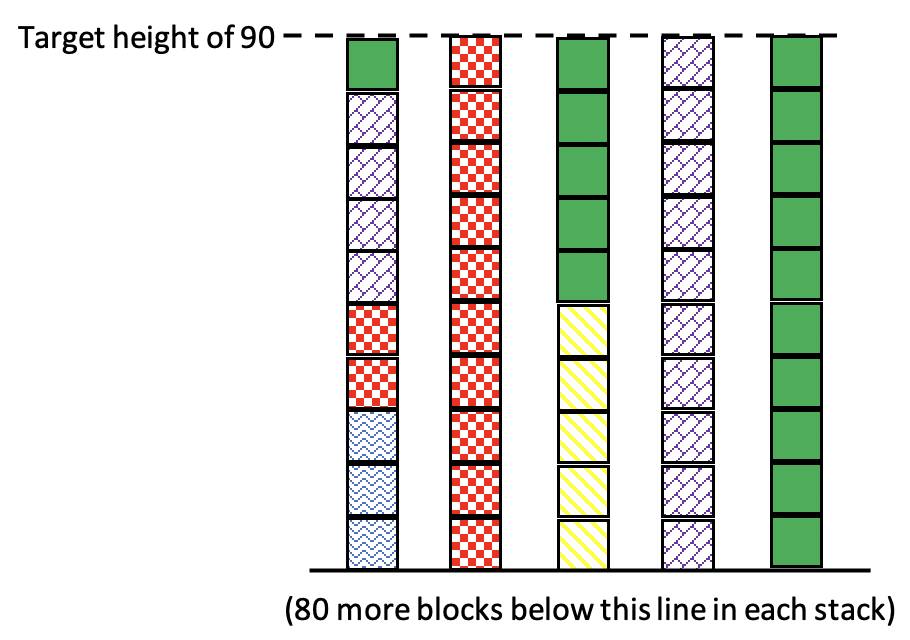
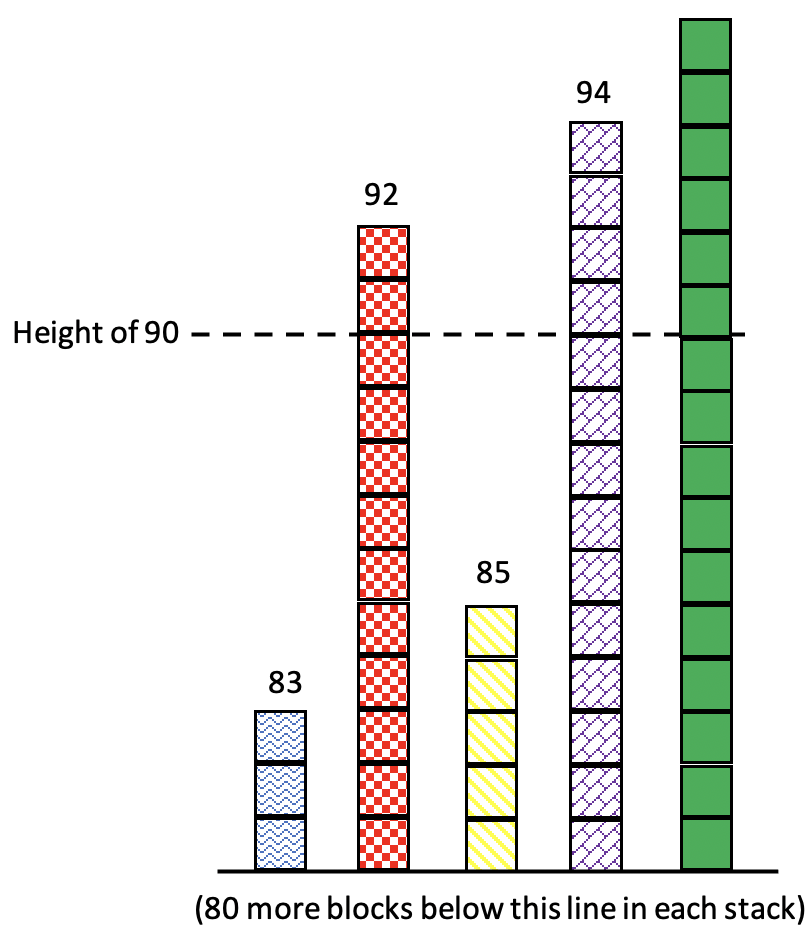
3. Make equal piles. Another useful interpretation of the mean is that it is what each score would be if all the scores were the same. In other words, Dorothy would have a mean score of 90 if all her scores were exactly 90. I like to visualize the scores as stacks of blocks. To keep our visual from being huge, let’s just look at the very top of it. Here’s a model showing all of Dorothy’s scores if you imagine 80 more blocks on the bottom of each stack:
Here are the scores again, moving some of the blocks around to try to make each of the piles 90 blocks tall:
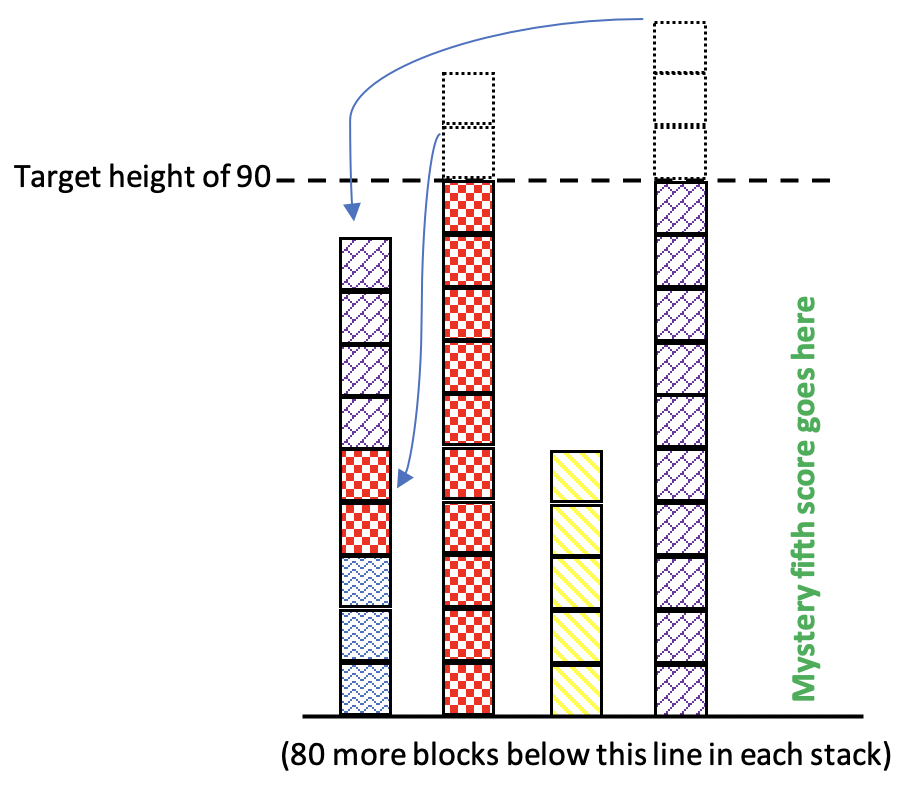
There are still some spaces that need to be filled in. The blocks we use to fill them in will make up the fifth score. Here is a set of scores that are all 90 (so the mean is definitely 90). The new blocks (in solid green) are the fifth score:
Here are the scores with all the blocks back in their proper stacks:
If you are thinking that this visual is very elaborate for something someone might sketch on scratch paper in a test situation, you aren’t wrong. However, students who develop the conceptual understanding of the mean as the value that each number would be if they were all the same will be able to reason through the problem like this using much simpler and rougher sketches in the moment.
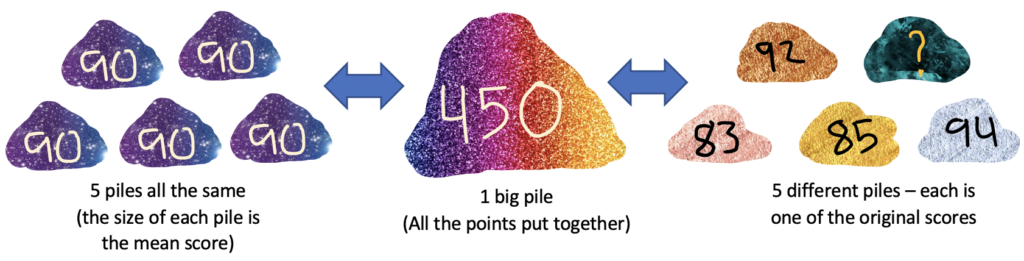
4. Find the total. Take a minute to think about the standard procedure we use for finding means. We add up all the numbers and then divide by how many numbers there were. Thinking about things a little more visually, we could imagine putting all the points into one big pile (adding them up) and then dividing that pile into the same number of piles we started with so that all the piles are the same size (dividing by the number of numbers). Because we know the big pile can be made into 5 smaller piles that are each 90, we can figure out how big the big pile is. The big pile is also the sum of the 5 individual scores, so we can figure out the missing score because we know the other 4.
5. Guess and check. Even when a situation is not multiple choice, guess and check can be a good strategy for identifying a missing number. If encountering this kind of question on a test, guess and check gets a little boost because the student already knows the answer must be one of the five answer choices. However, a slightly better strategy is an educated guess and check. Before playing plug-and-chug with the answer choices, students should still make an estimate and use it to inform their first guess — and then use the results of each guess to inform the next. For a detailed example of this, with a similar problem to this one, see In Defense of Guess and Check.
Having a strong conceptual understanding of the mean is worth much more than a few points on a test. We encounter means of data all the time out here in the real world, and having different ways of thinking about what the mean is puts students in a much stronger position for evaluating that information. Having these deep conceptual and visual understandings sets students up to think about what information they are getting and what information they are missing when all they know is the mean of a set of data.
Being able to estimate the mean is also a useful skill for “cluster estimation.” For example, if you have an estimate of the mean cost of the items in your grocery cart, you can estimate the total by multiplying that by the number of items. Depending on how you shop, this may be a more convenient way of estimating than trying to hold a running total in your head.
Wondering how to teach the mean in more exciting ways than just that one formula? One good approach for generating deep thinking is to start with the mean and ask students to supply the data. For example, can you come up with three different sets of data that all have a mean of 10? What if they all have to have four numbers in them? What if three of the four numbers have to be the same? What if two of the numbers have to be greater than 20? What if you have to use at least one fraction? Try some of these tasks yourself and pay attention to the kind of reasoning you do. How is it similar or different to the kind of reasoning you do with a more traditional task about finding a mean?

Sarah Lonberg-Lew has been teaching and tutoring math in one form or another since college. She has worked with students ranging in age from 7 to 70, but currently focuses on adult basic education and high school equivalency. Sarah’s work with the SABES Mathematics and Adult Numeracy Curriculum & Instruction PD Center at TERC includes developing and facilitating trainings and assisting programs with curriculum development. She is the treasurer for the Adult Numeracy Network.