Will This Be on the Test? (September 2023)
by Aren Lew
Welcome to the latest installment of our monthly series, “Will This Be on the Test?” Each month, we’ll feature a new question similar to something adult learners might see on a high school equivalency test and a discussion of how one might go about tackling the problem conceptually.
Welcome back to our continuing exploration of how to bring real conceptual reasoning to questions students might encounter on a standardized test. Here is this month’s question:
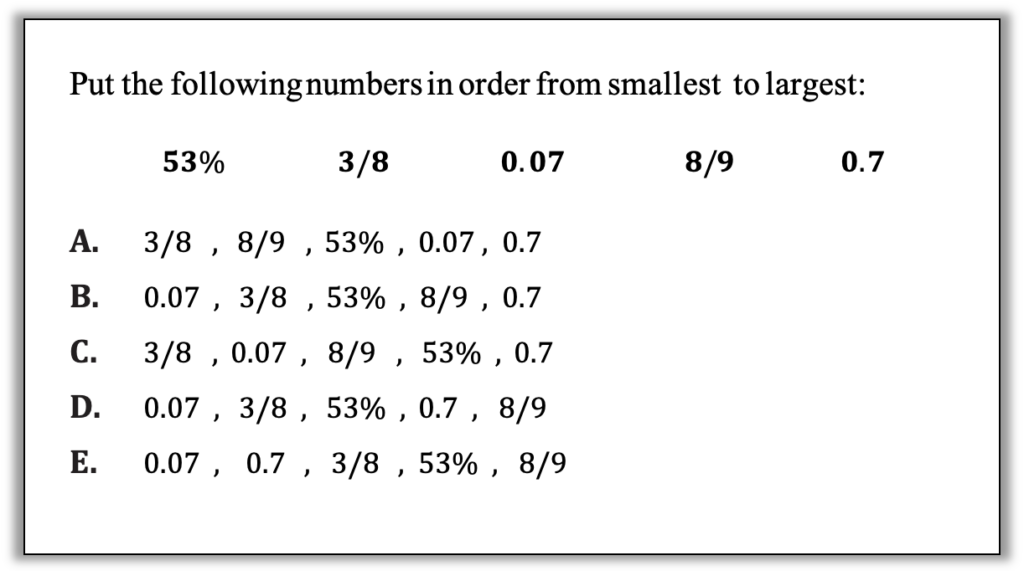
How can you approach this question in a way that makes sense to you? What conceptual understandings or visual tools can you bring to bear? What mathematical concepts do students really need to be able to tackle this problem? How might your real-world experience help you reason about this?
Curious as to how a non-human might approach this, I asked ChatGPT to order the numbers. The first answer it gave me was wrong(!), but when I asked it to explain its reasoning, it came up with a correct answer by converting all the numbers to decimals and putting the decimals in order. This is a valid approach, especially if you have a calculator (or are a computer), but are there any other ways to do it? I pressed ChatGPT to come up with other ways of thinking, but it only had one approach. It’s a good thing we humans have the ability to think creatively and flexibly. Let’s look at some more conceptual and visual approaches.
Here are some other possible approaches:
1. Estimate— Consider small and big. All the numbers in the question are between 0 and 1. Do any of the numbers in the list jump out at being close to zero or close to a whole? A student might recognize 8/9 as being “all the pieces except one” and therefore almost a whole. (Think of a pie divided into 9 pieces and 8 of the pieces are left—that means that most of the pie is still there.) What other number or numbers in the list can be classified as being close to 0 or close to 1?
2. Estimate—Compare to a benchmark. If a student can compare numbers to the benchmark of 1 / 2 (or 50% or 0.5) they may be able to get a handle on the order and eliminate some answer choices. Here are some ways students might compare some of the numbers to benchmark 1 / 2:
- 53%: I know that 50% is exactly half, so 53% is a little more than half.
- 3/8: I know that 4 is half of 8, so 4/8 would be half the pieces. 3/8 is less than 4/8, so it is less than 1 / 2.
- 0.07: This is 7 hundredths, so it is only 7 out of 100 pieces. That is a very small part of the whole. Half of the pieces would be 50 so this is a lot less than half.
How would you compare the other two numbers to benchmark 1 / 2? What answer choices can you eliminate based on this reasoning? How is it helpful to think about how close or far away the numbers are from benchmark 1 / 2?
3. Draw pictures. Another way to get an idea of which numbers are bigger and which are smaller is by drawing pictures or sketches to represent the numbers. We often draw pictures of fractions on circles (like pizzas or pies), but other shapes work as well. When decimals are in the mix, it might be easier to use squares. (Why do you think it matters whether we represent all the numbers using the same kind of visual?) Here are a few of the numbers represented visually. Note that sometimes using squares provides different options for representing fractions that you have with circles.
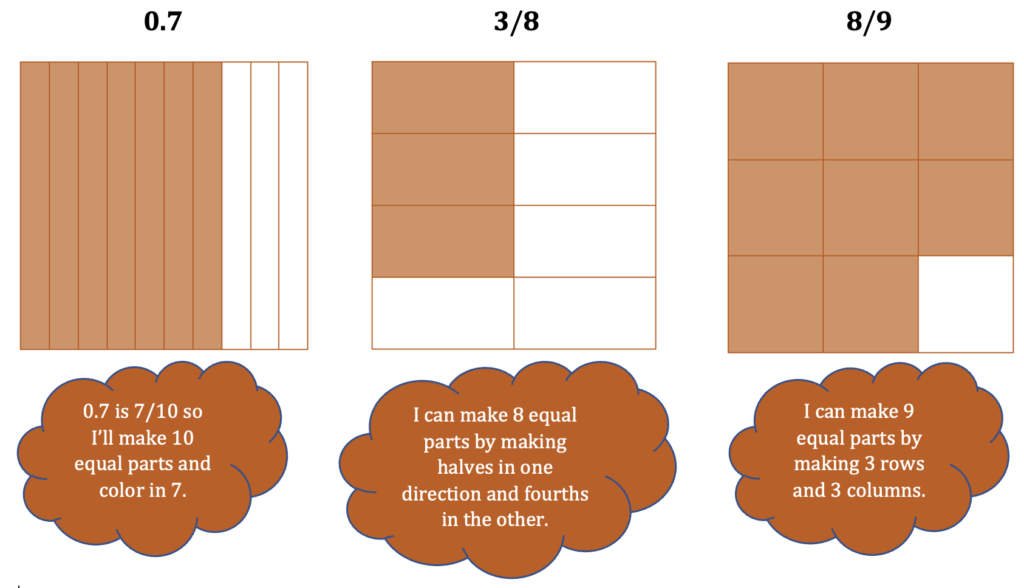
How could you draw or sketch the other two numbers? How might these pictures help a student put the numbers in order? (Sometimes it helps to look at the empty spaces as well as the filled in spaces.)
4. Visualize using number lines. Number lines are a great tool for comparing numbers, but it might be challenging to put all these numbers on the same number line because they are in different forms and even the fractions have different denominators. In this case, it might help to draw several number lines like this:
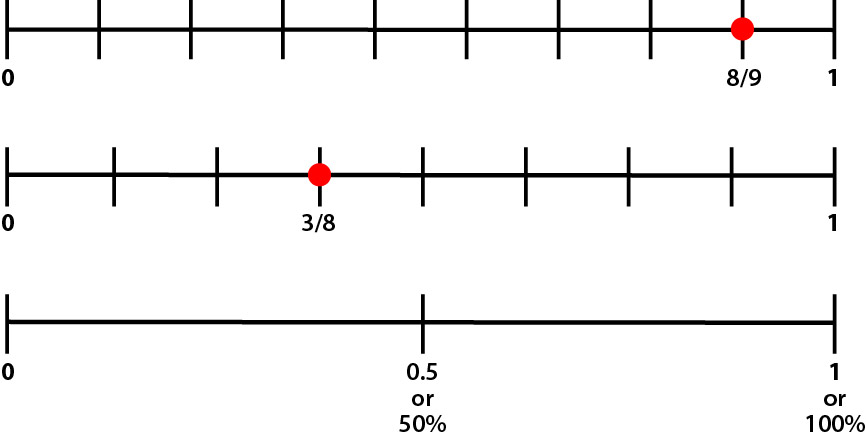
Where would you sketch the remaining 3 numbers (0.07, 0.7, and 53%) on that bottom number line?
I used to teach separate lessons on fractions, decimals, and percents, as if they were completely different kinds of numbers and not just different ways of describing the numbers between the whole numbers. After having taught several lessons on each of those topics, I would teach a lesson on the steps for converting between them. At the end of all these lessons, my students had been exposed to lots of procedures but had very little conceptual understanding. In 2008-2009, only 22% of students who took an algebra readiness test at Santa Barbara City College were able to correctly put in order a set of four numbers consisting of two simple fractions and two decimals, even though some of those who got it wrong were able to convert fractions to decimals correctly (Stigler, Givvin, & Thompson, 2010). Looking back, I shouldn’t have been surprised if my students produced similar outcomes because I hadn’t taught them anything about how to reason about the sizes of fractions and decimals.
I have since learned that these topics—fractions, decimals, and percents—do not need to be taught separately, and in fact shouldn’t be taught separately. Students can develop conceptual understanding of the size and meaning of 1 / 2 , 0.5, and 50% all at the same time and then move on to grow their understanding of numbers between whole numbers as they expand their set of benchmarks to fourths, eighths, thirds, and more. And through this progression, they also learn how to use those benchmarks to reason about numbers that are close to them or far away from them. Check out EMPower: Using Benchmarks for a sequence of well-written lessons that develop conceptual understanding in this way. You can even download for free Lesson 6: Equal Measures and learn how to use pattern blocks and fraction strips as concrete tools for building conceptual understanding. Want to see fraction strips in action? Check out Creating Fractions Strips and Using Fraction Strips for Operations.

Aren Lew has been teaching and tutoring math in one form or another since college. They have worked with students ranging in age from 7 to 70, but currently focuses on adult basic education and high school equivalency. Aren’s work with the SABES Mathematics and Adult Numeracy Curriculum & Instruction PD Team at TERC includes developing and facilitating trainings and assisting programs with curriculum development. They are the treasurer for the Adult Numeracy Network.