Will This Be on the Test? (March 2023)
by Sarah Lonberg-Lew
Welcome to the latest installment of our monthly series, “Will This Be on the Test?” Each month, we’ll feature a new question similar to something adult learners might see on a high school equivalency test and a discussion of how one might go about tackling the problem conceptually.
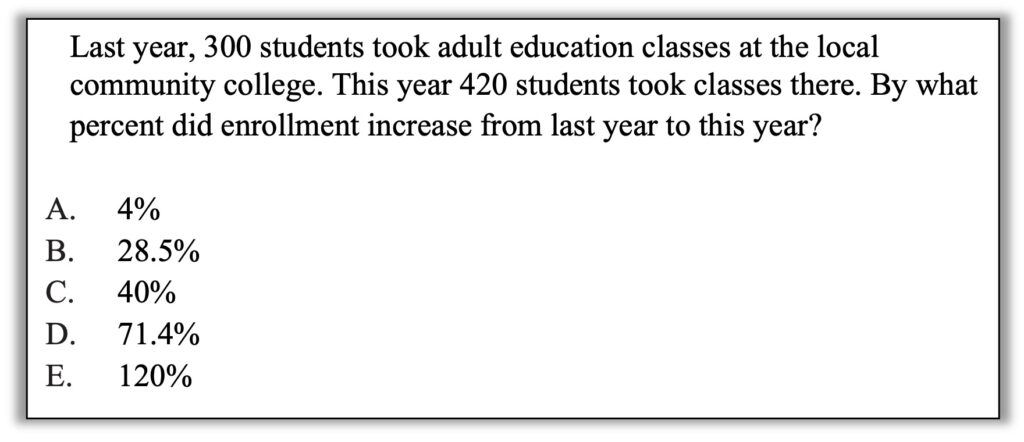
Welcome back to our continuing exploration of how to bring real conceptual reasoning to questions students might encounter on a standardized test. Here is this month’s problem:
How can you approach this question in a way that makes sense to you? What conceptual understandings or visual tools can you bring to bear? What mathematical concepts do students really need to be able to tackle this problem? How might your real-world experience help you reason about this?
Reasoning about percents is thorny for many adult learners even though they are often very motivated to develop fluency with percents. Percents are so important in everyday life and it can be frustrating or embarrassing to feel that you can’t make sense of them. Some learners have struggled with memorizing different procedures for different kinds of percent problems. Others have learned more general procedural approaches like the percent triangle or the percent proportion, but these can also be problematic if there is no conceptual understanding behind them.
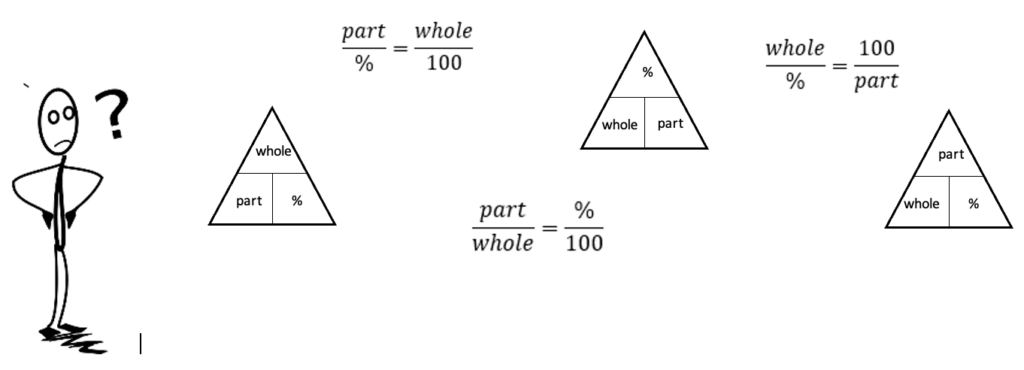
To use these tools, students have to be able to remember how to set them up and also have to be able to identify which number plays which role in a percent task. Neither of these things is easy. Instead of spending time memorizing formulas and tricks, students are better served by using their learning time to develop deep conceptual understanding. And the procedures above leave out the important concept of percent change, or at least require some modification to be able to handle it (another thing to memorize).
It is possible to make sense of percent change by connecting to experience and building on prior knowledge.
Here are some possible approaches:
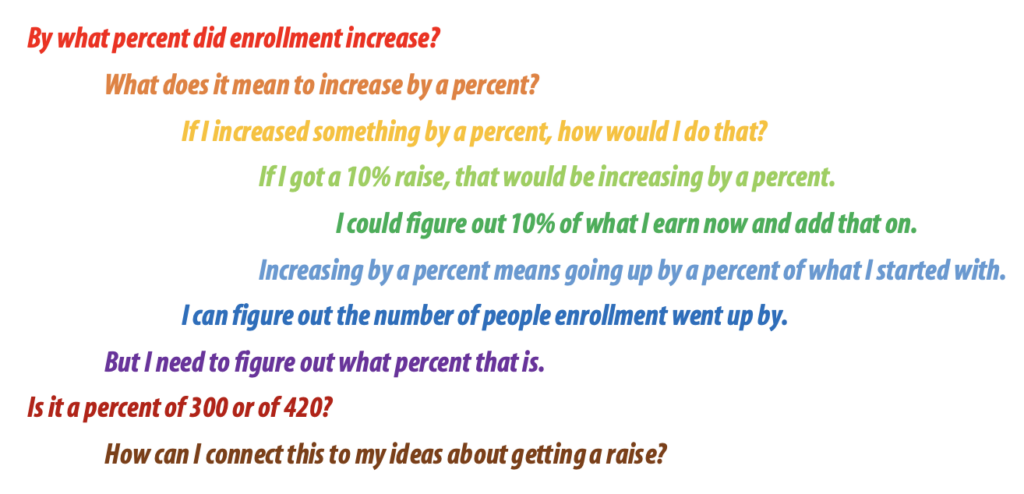
1. Make sense of the question. This is an important first step for any math task and it means much more than underlining the question and important information. For a question like this, a student will not get very far if they can’t make sense of what it means to increase by a percent. Identifying that this understanding is necessary will help students find an entry point into the task. A student might make sense of the question by connecting it to other questions and searching for a connection to their own life:
Through modeling thinking aloud and daring to reach beyond what is in the task, you can help students develop the agency to ask questions and use connections to make sense of challenging tasks.
2. Estimate! Enrollment went up by 120 people. Does that seem like a big increase or a small increase? A student who has made sense of the question might rephrase this as, “Does that seem like a big or small part of where it started?” Checking out a benchmark percent could be a good way to get a handle on that question. Half, or 50%, of last year’s enrollment would be 150 people. The increase was smaller than that, so it was an increase of less than 50%. How many answer choices can be eliminated just from this quick investigation? How many answer choices still seem reasonable?
3. Build on benchmarks. Having figured out that a 50% increase would be 150 people, a student might consider how they could use that information to get closer to an increase of 120 people. From thinking about a 50% increase, a student might reason that a 25% increase would be half as big, or 75 people. That’s too small, so the percent increase must be between 25% and 50%. Another good benchmark to use is 10% and its multiples. An increase of 10% would be 30 more people. How might multiples of 10% get a student closer to a precise answer here? The great thing about an approach like this is it can get you to a precise answer or a pretty good estimate even if the question is not multiple choice!
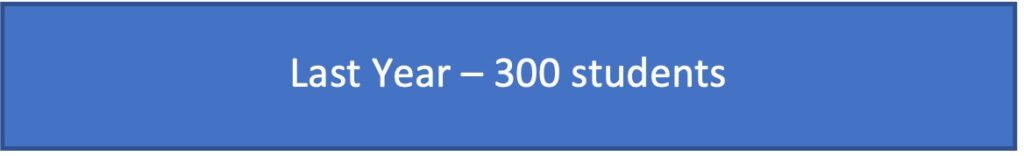
4. See the change in a bar model. Drawing a bar model to illustrate the story can help a student get a good handle on what is going on. They might start with a bar to illustrate last year’s enrollment, or the beginning of the story:
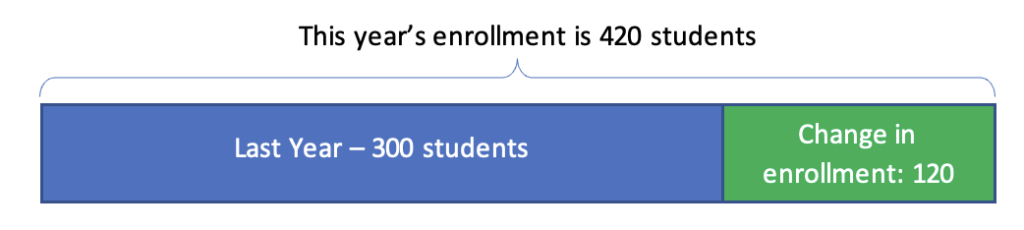
Then add on a bar to represent the change to this year’s enrollment:
Then the student could redraw the diagram to be able to see the change as a part of the original enrollment.
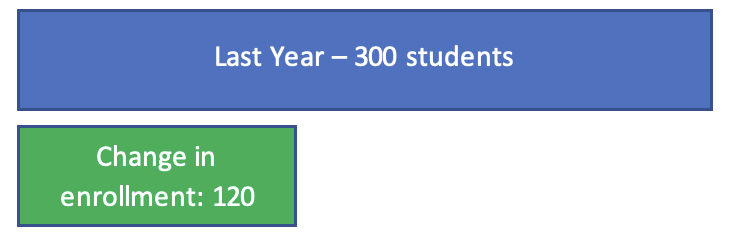
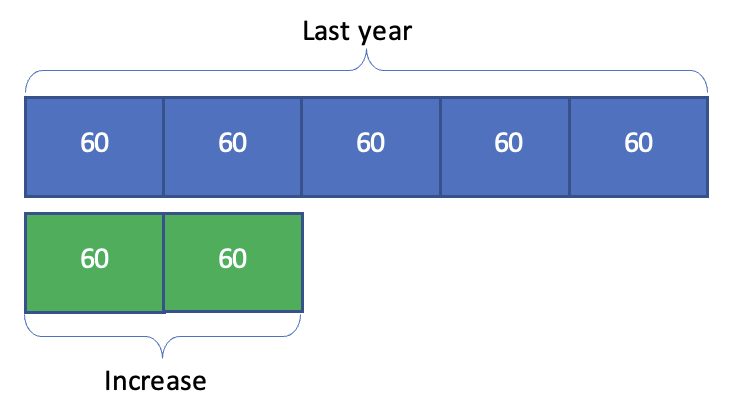
From here the student might estimate from the visual that the change is less than half of last year’s enrollment. Or, to get a more precise answer, they might look for a way to break up the two bars into equally-sized pieces. For example, both last year’s enrollment and the change can be broken into groups of 60 students. How does this help with figuring out what percent the change is of last year’s enrollment?
5. Work backwards. If figuring out what percent the increase is feels too daunting, a student can switch the task around and use the answer choices to make it a question about increasing by a percent. If the enrollment increased by 4%, would it come to 350? What about if it increased by 28.5%? (A student who is not comfortable with a percent with a decimal in it but is empowered to estimate and explore alternatives might calculate a 30% increase instead and see if that got close.)
When I was in school, I learned a formula for calculating percent change. Because I was skilled at memorizing and applying formulas, this served me well, but it always seemed arbitrary to me that the formula gave the change as a percent of the starting amount and not the ending amount. I could see no reason for that but never bothered to ask anyone about it or try to figure it out myself. I figured it was just one of those things that the people in charge of math had decided on and now we all had to do it that way. Looking back, I realize that even though I was skilled at calculating percent change, I had no idea what it actually meant.
After learning the value of teaching and learning math conceptually, I eventually took the initiative to make a connection between finding percent change and changing something by a percent, and that cleared the concept right up for me. Now when changing something by a percent, I start with the original value, not the changed value. When asking by what percent something changed, I now ask what percent the change was of the original value because it’s really the same situation with different information unknown—the relationships have not changed.
Students need to be empowered to look beyond the task in front of them, to make connections to their experience and prior knowledge, and to make sense of and internalize concepts instead of simply memorizing rules and procedures.

Sarah Lonberg-Lew has been teaching and tutoring math in one form or another since college. She has worked with students ranging in age from 7 to 70, but currently focuses on adult basic education and high school equivalency. Sarah’s work with the SABES Mathematics and Adult Numeracy Curriculum & Instruction PD Center at TERC includes developing and facilitating trainings and assisting programs with curriculum development. She is the treasurer for the Adult Numeracy Network.