Will This Be on the Test? (June 2025)
by Aren Lew
Welcome to the 50th edition of our monthly series, “Will This Be on the Test?” Each month, we’ll feature a new question similar to something adult learners might see on a high school equivalency test and a discussion of how one might go about tackling the problem conceptually.
Welcome back to our continuing exploration of how to bring real conceptual reasoning to questions students might encounter on a standardized test.
Working with percents is a topic that I’ve always found students to be eager to learn about. They are something that we deal with every day, but the procedures I learned in school seemed complicated and inscrutable to me. I believe my students have had the same experience. The good news is there are lots of ways to reason about percents conceptually without relying on memorized procedures.
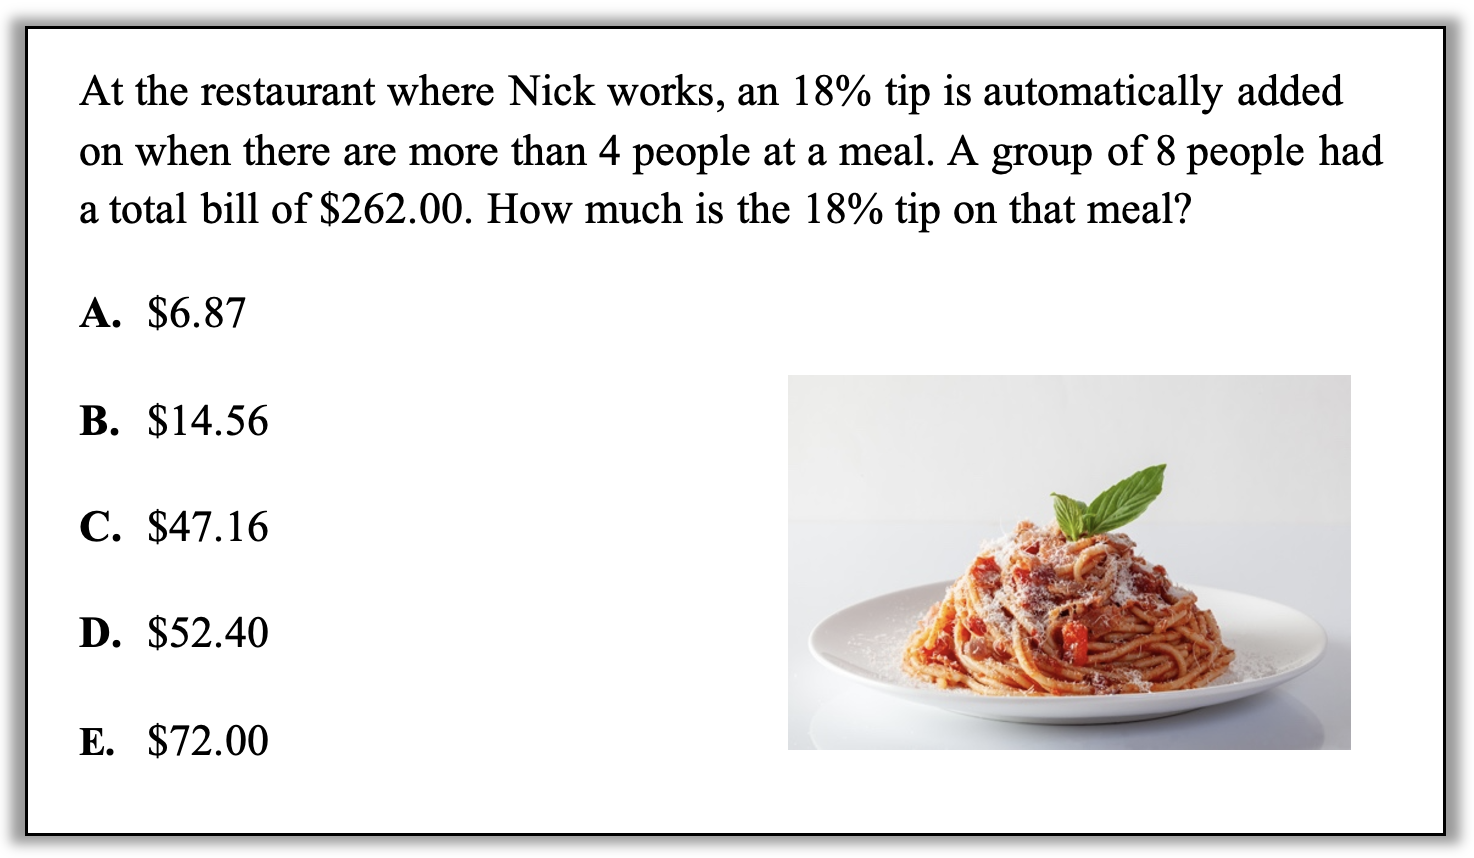
Here is this month’s question:

How can you approach this question in a way that makes sense to you? What conceptual understandings or visual tools can you bring to bear? What mathematical concepts do students really need to be able to tackle this problem? How might your real-world experience help you reason about this?
What do you understand about percents that could help you reason about this without relying on a memorized procedure?
Here are some approaches based on conceptual understanding of percents:
1. Think of percent as “for every hundred”. The word percent literally means “for every hundred” (per = for every; cent = 100). In this case, the tip will be $18 for every $100 of the cost of the meal. A student might organize their thinking like this:
$262 is two hundreds and part of a hundred.
For each hundred, there’s $18 of tip.
So, the tip is two $18’s and part of an $18.
$62 is more than half of a hundred, so the amount of tip on the $62 is more than half of $18.
All together, the tip is $18 + $18 + more than half of $18.
Based on this thinking, which answer choices seem reasonable?
2. Estimate with a benchmark. One beautiful thing about percents is how they lend themselves to building a set of benchmarks that are accessible and efficient to reason with. The first benchmark most students develop is 50%, or one-half. In this case, benchmark 50% will not help a lot because 18% is a lot less than 50% and all of the answer choices are a lot less than half of $262. However, 18% is closer to 25%, which is also conceptually accessible and can be calculated without a lot of work. 25% is half of 50%, so to find 25%, you can take half and then take half again, like this:
Half of $262 is $131. ➜ ➜ Half of $131 is $65.50 ➜ ➜ 25% of $262 is $65.50.
Since 18% is less than 25%, that gives some idea of about how much the tip might be. Your set of benchmarks can also be expanded to other percents. For example, knowing the whole can be broken up these ways gives lots of options.
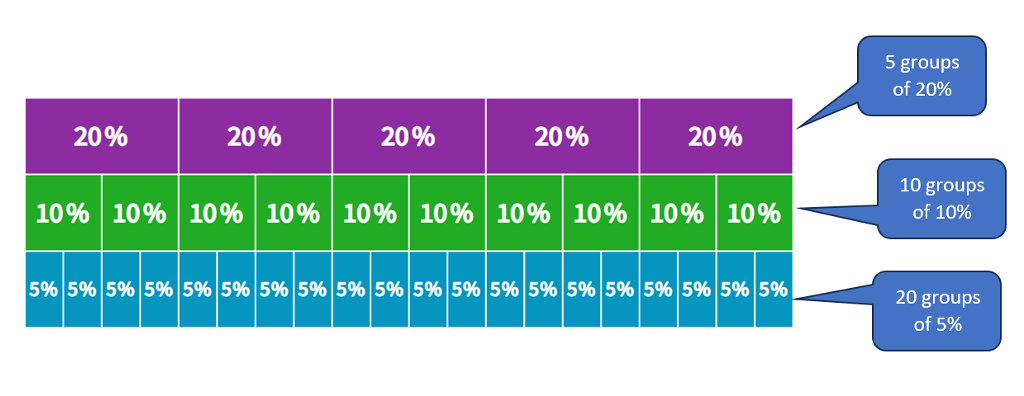
The closest block in this set to 18% is 20%, and it takes 5 blocks of 20% to make 100%, so you can get to 20% by dividing by 5. (In other words, 20% is the same as 1/5.) Which answer choices seem most reasonable when using 20% as a benchmark?
3. Build the percent with chunks. . In this question, the task is to find 18% of a number. You can’t make a neat bar model where each block is 18% because 18% doesn’t go evenly into 100%. However, you can build 18% out of blocks that do fit in a neat model. For example, a student might reason like this:
10% of $262 can be found by dividing $262 by 10, so it is $26.20.
5% of $262 is half of 10% of $262, so it is $13.10.
3% of $262 is a little more than half of 5% of $262, so it is about $7.00 or $8.00.
All together that means that 18% of $262 is about $47.
4. Estimate with a double number line. A double number line is a great tool for seeing relationships in reasoning with percents. An understanding of percents that can be illustrated on the double number line is that the relationship between the tip and the total is the same as the relationship between 18 and 100. A number line sketch showing benchmarks can set up a student to make a good estimate.
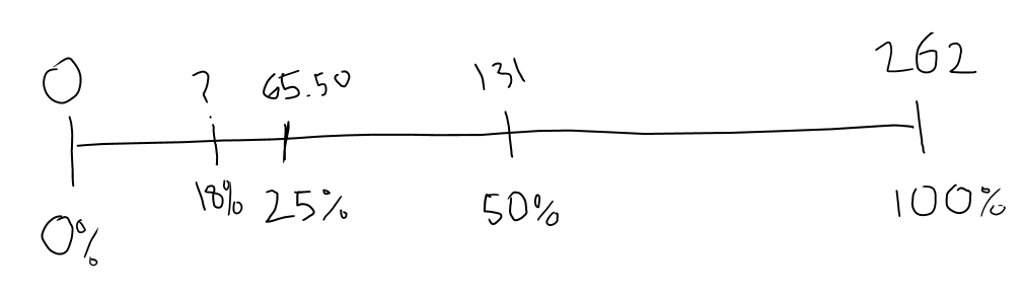
Here, marking 50% and 25% sets you up to eyeball where 18% would be and about how much it would be in relation to the other numbers on the top of the number line.
All of these strategies relied to some extent on estimation, which is often good enough on multiple-choice tests and also often good enough in the real world. Which of these strategies could you adapt if you needed to find a precise answer?
Of course there are other ways to solve this that may seem simpler and faster. Procedures like converting a percent to a decimal by moving the decimal point or using the “percent proportion” are effective and efficient. And they are reliable in the sense that, when applied correctly, they reliably produce the correct answer. However, for many learners, these procedures are unreliable because the steps are not meaningful or connected to understanding and it is as easy to apply them incorrectly (move the decimal point in the wrong direction, divide when you should multiply or vice versa, set up the proportion incorrectly) as it is to apply them correctly. And when there is no understanding attached to procedures, it becomes a matter of luck whether they produce the right answer.

Aren Lew has worked in the field of adult numeracy for over ten years, both as a classroom teacher and providing professional development for math and numeracy teachers. They are a consultant for the SABES Mathematics and Adult Numeracy Curriculum & Instruction PD Team at TERC where they develop and facilitate trainings and workshops and coach numeracy teachers. They are the treasurer for the Adult Numeracy Network.