Will This Be on the Test? (February 2026)
by Aren Lew
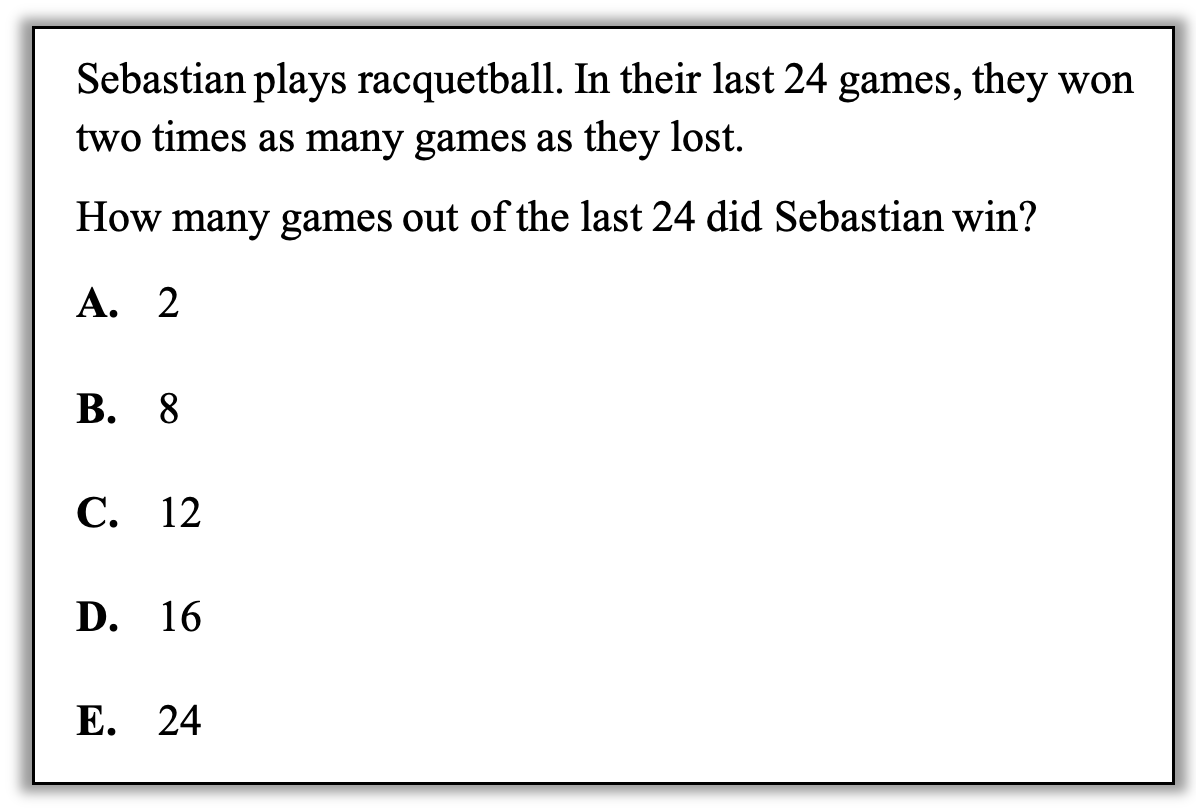
Welcome to the latest installment of our series, “Will This Be on the Test?” Each WTBotT features a new question similar to something adult learners might see on a high school equivalency test and a discussion of how one might go about tackling the problem conceptually.
Welcome back to our continuing exploration of how to bring real conceptual reasoning to questions students might encounter on a standardized test.
Let’s really lean into visuals this time. For this question, my challenge to you is, how many ways can you think of to visualize the relationships in the question and then use them to figure out the answer? While a student answering a question on a test only needs one strategy (and it doesn’t have to be visual), as teachers we should keep strengthening our ability to visualize relationships in multiple ways so that we can make sense of student thinking and open more doors for students. Both teachers and students can be resistant to drawing pictures because it can feel like it takes too long or that it is just for kids, but when we see or draw pictures, we take information into our brains in another way, so we are better equipped to make sense of it. Drawing pictures helps us make information provided in text and symbols more concrete and accessible. It gives us more ways to understand the task so that we are more likely to see paths to the solution.
How can you approach this question in a way that makes sense to you? What conceptual understandings or visual tools can you bring to bear? What mathematical concepts do students really need to be able to tackle this problem? How might your real-world experience help you reason about this?
Remember, this time the extra challenge is to see how many visual approaches you can come up with (but other strategies are great too!).
Here are four visuals I thought of:
1. Use a bar model. Here’s how I’d use a bar model to visualize the relationships in this task.
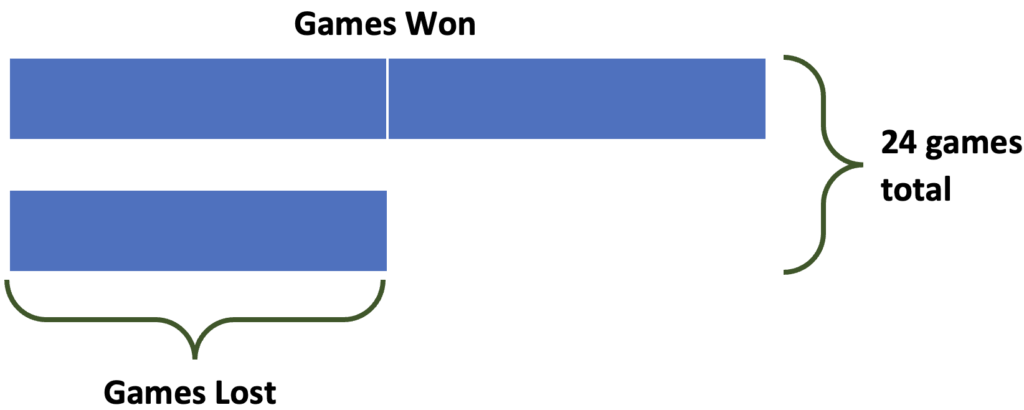
In the model, I’ve shown that the number of games won is twice the number of games lost by making the top bar out of twice as many equal sized blocks as the bottom bar. The label on the side shows the total number of blocks. Can you see how all the information in the task is in the model? Can you use that information to figure out the value of one block? How does that help answer the question? (For more on bar models, see https://sabes.org/video/singapore-strips-how-video.)
2. Tally the games in a t-chart. Another way of visualizing Sebastian winning twice as many games as they lost is to make tick marks in a t-chart, noting two wins and one loss in each row:
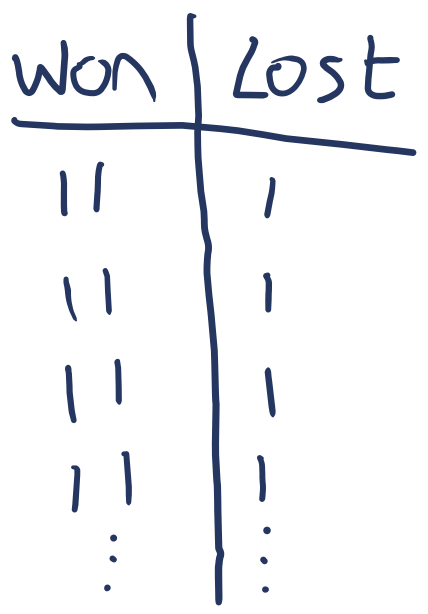
How does this visual represent that Sebastian won two times as many games as they lost? How could continuing this chart answer the question? What structure might a student see in this chart that could help them answer the question?
3. Make “piles” and move games around. I noticed that my first two visual approaches started with the information that Sebastian won twice as many games as they lost, so I wondered how I might visualize it if I started instead with the information that they played 24 games all together. One idea I had was to start with splitting the games into two even piles and then move games from one pile to the other until one is twice as tall as the other. Here are a few steps:
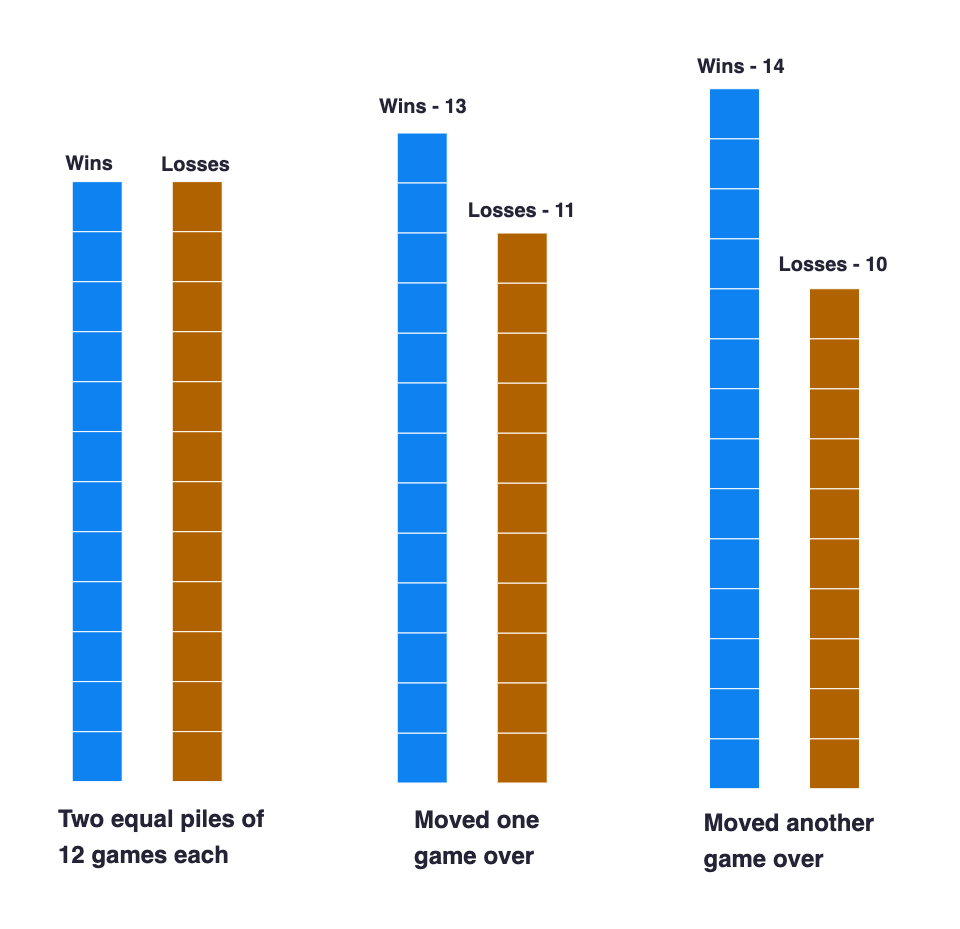
You may be thinking that this is too cumbersome for a student to do on a test. However, the idea of the visual and a quick sketch or two might be enough to help a student reason through this. And if the student does need to draw and see all the boxes, then it will be worth the time it takes them to draw them.
4. Think about parts on a number line. Another way to start with the total and figure out the size of the parts is to draw a number line to represent the total and think about where to break it into two parts. This could be a visual format for some guess-and-check:
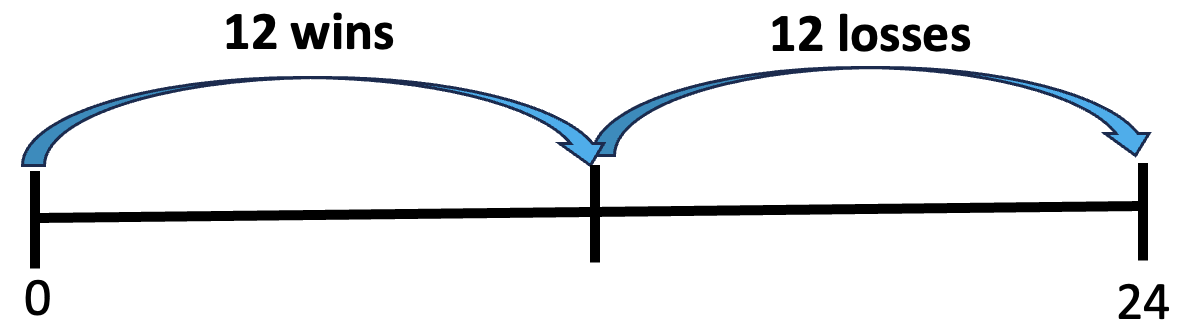
This number line shows breaking the wins and losses into two equal parts. This isn’t right because the wins part should be twice as big as the losses part.
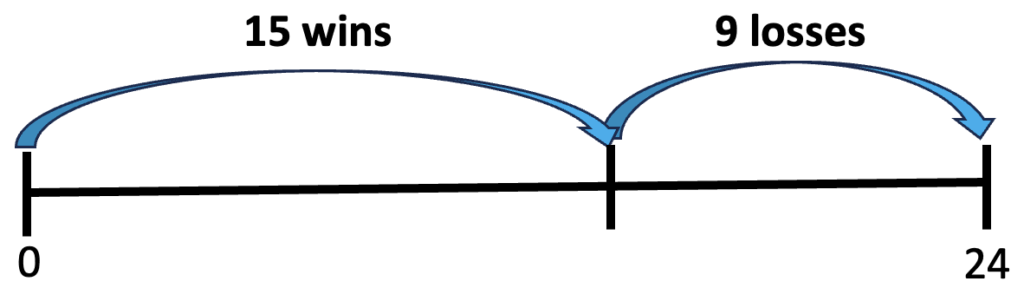
This is a better because the wins are more than the losses, but it’s not right because 15 is not twice as big as 9. 15 is less than twice as big as 9, so let’s make the wins part even bigger.
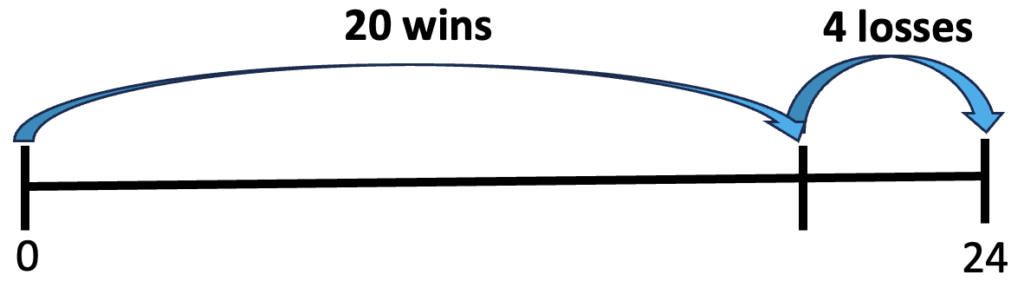
Oops! 20 is more than twice as big as 4, so this went too far. The number of wins must be more than 15, but less than 20.
Some thinking questions: How is the reasoning similar or different in each of these visualizations? Where the reasoning is similar, what is the value of having more than one way to illustrate it? Would you illustrate any of these ways of reasoning differently? How else could you reason about or visualize the relationships in this task? What understandings might grow from drawing, looking at, and playing with these visualizations?
I’ve been thinking visually about mathematical relationships for a long time and often can see the picture in my head without drawing it, but if the picture isn’t clear in my head, I can still benefit by letting my eyes in on the problem-solving when I draw it out. I tell you this because a common objection to drawing pictures is that it takes too long. My response is that it takes as long as it takes. We draw the pictures with as much detail and care as we need to help us see. Students and teachers who practice drawing pictures grow their capacity for thinking visually and become more efficient reasoners in the long term. Carefully drawn, detailed, concrete pictures can evolve into sketches as the concepts those pictures were illustrating become more solid. Sketches can pave the way to mental images. But when we are learning a new concept, we start again with careful drawings. Time spent visualizing is time spent learning, so it is not wasted.

Aren Lew has worked in the field of adult numeracy for over ten years, both as a classroom teacher and providing professional development for math and numeracy teachers. They are a consultant for the SABES Mathematics and Adult Numeracy Curriculum & Instruction PD Team at TERC where they develop and facilitate trainings and workshops and coach numeracy teachers. They are the treasurer for the Adult Numeracy Network.