Will This Be on the Test? (Dec 2021)
by Sarah Lonberg-Lew
Welcome to the latest installment of our monthly series, “Will This Be on the Test?” Each month, we’ll feature a new question similar to something adult learners might see on a high school equivalency test and a discussion of how one might go about tackling the problem conceptually.
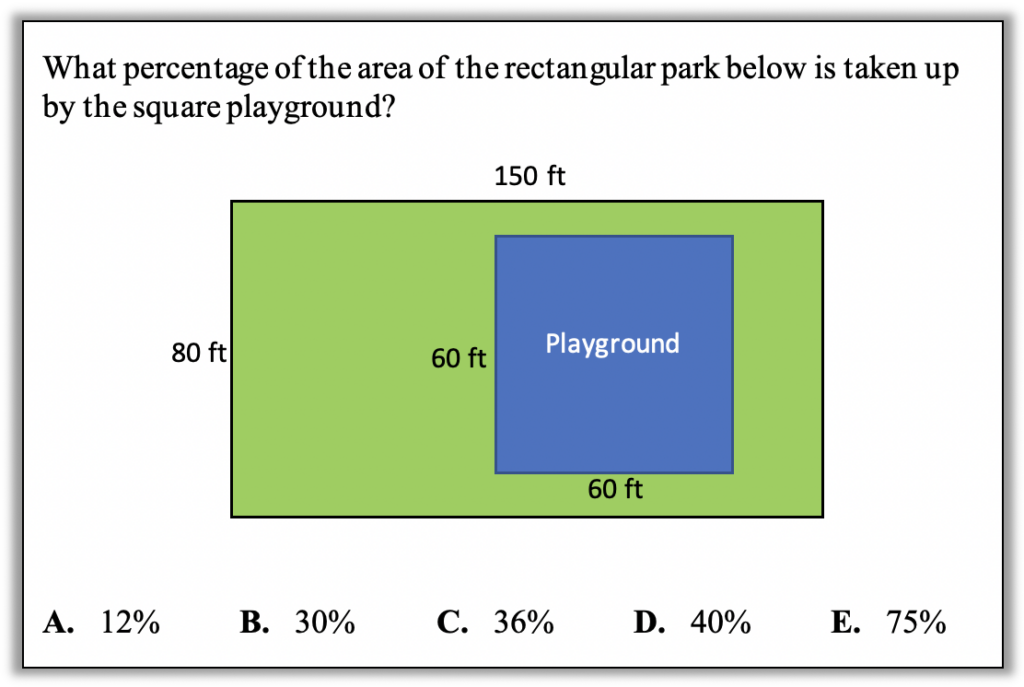
Welcome back to our continuing exploration of how to bring real conceptual reasoning to questions students might encounter on a high school equivalency test. Here is this month’s question:
Before you read further, allow yourself to bring your full mathematical reasoning power to bear on this challenge. How many strategies can you think of? What visuals could you use to help you solve this? Also ask yourself, what skills and understandings do students really need to be able to answer this?
This question might seem intense because it involves several domains and potentially quite a few steps and calculations. However, the fact that it pulls together geometry, operations with whole numbers, and percents also means that it has multiple entry points and that students may be able to find an approach that plays to their strengths. Here are some possible approaches:
1.Eyeball it (otherwise known as making a quick estimate). How much of the park does the playground appear to take up? It’s tough to say because of how the playground is not centered or lined up with any of the edges of the park, but a student might still eliminate one or two answer choices even from a quick glance. (Note: Different tests have different conventions about drawing diagrams to scale. Your students should know going into a test whether they can expect diagrams to be drawn to scale and should be in the habit of asking themselves whether the measurements appear reasonable before making an estimate based on a diagram. In this case, the length marked 80 ft appears to be more than half of the length marked 150 ft and the lengths marked 60 ft appear to be the same and are less than the length marked 80 ft, so it is reasonable to base an estimate on this diagram.)
2.Sketch a new diagram for a better estimate. A student who notices that the placement of the playground makes it difficult to see clearly what fraction of the whole park it takes up might redraw the picture to put the playground in a more convenient place. A rough sketch using some benchmark fractions may make it easier to estimate.
Below is an animation with an example. Please give a moment for it to load and run completely.

From this sketch, the student may be able to make an estimate they feel more confident about, reasoning that the playground is definitely less than half the area of the whole park, but it appears to be more than half of the left half of the park (or appears to be more than one-fourth of the area because one-fourth is half of a half). See the diagram below if that last sentence was confusing! From here, a student could eliminate any answer choice that is more than half (answer choice E) or less than one-fourth (answer choice A). They might even refine their estimate and eliminate more choices by considering how much less than 50% or how much more than 25% of the park the playground now appears to be.
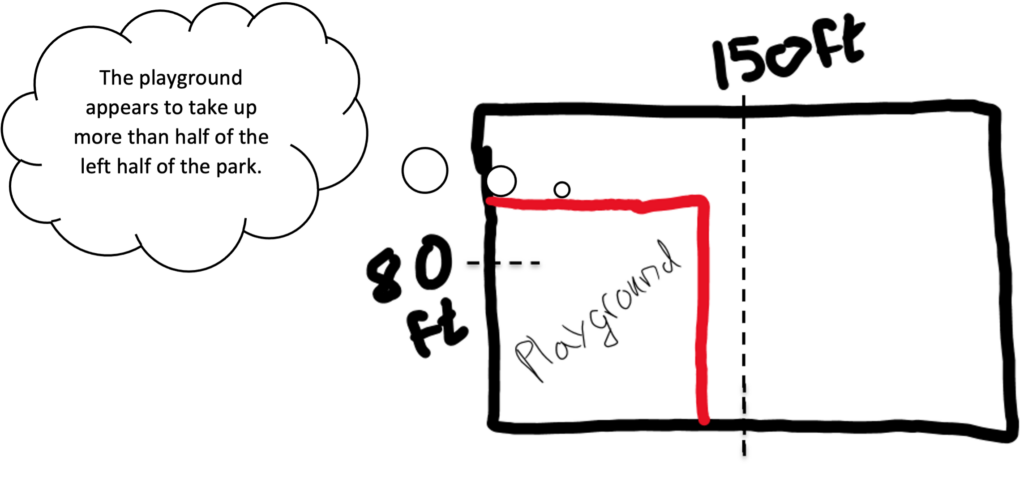
It takes a special kind of mathematical confidence and empowerment to redraw a diagram, especially one in a test or a textbook. For one thing, students must have the conceptual understanding that the fraction of the park taken up by the playground is the same no matter where in the park the playground is located. Even more importantly, though, students must understand that math is not something that is handed down to them from teachers and textbooks but is something that they can participate in as equal partners. They can therefore reframe the problem in a way that makes sense to them. When we teach for conceptual understanding, we help students gain ownership of their understandings and the power to use them flexibly.
3. Calculate the areas and estimate with benchmarks. A student could calculate the areas of the playground and the park and use benchmarks to estimate the percent of the park taken up by the playground. The area of the playground is 60 ft x 60 ft = 3,600 square feet. The area of the park is 80 ft x 150 ft = 12,000 square feet. A student might reason about the percent of the park taken up by the playground like this:
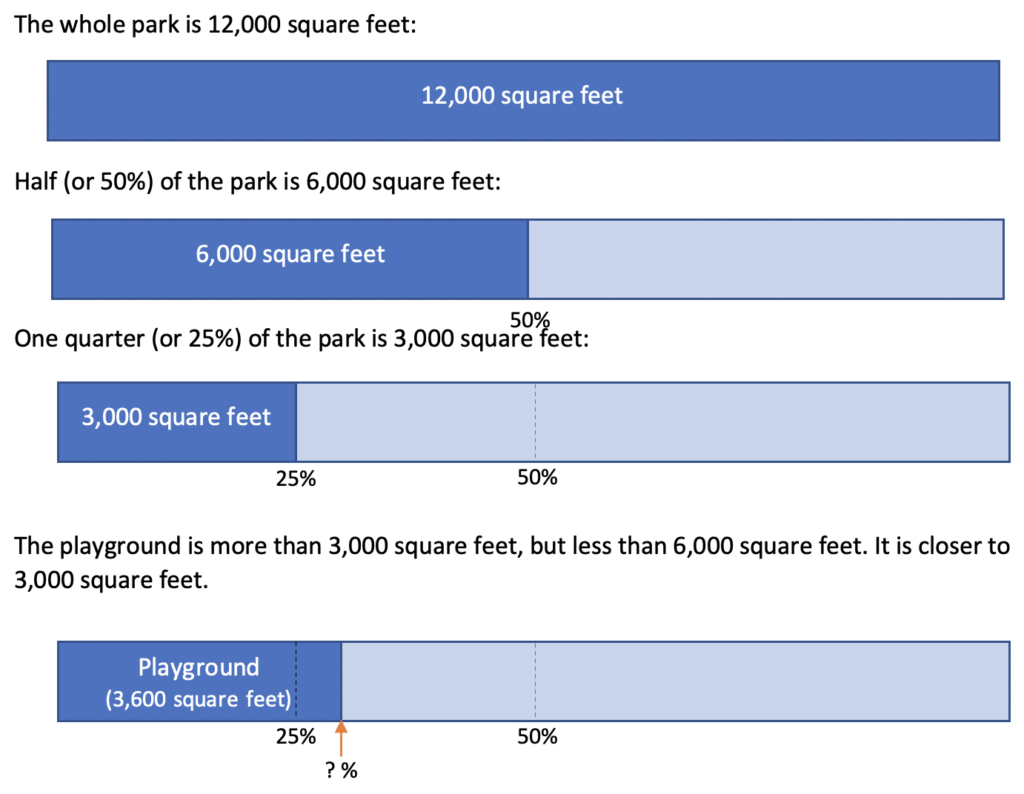
This model is good enough for a pretty reasonable estimate. In fact, it may be good enough for a student to decide on the most reasonable answer choice.
4.Simplify to friendlier numbers. Starting with the fraction 3600/120000, a student might reason that the fraction can be read as 36 hundreds out of 120 hundreds and therefore it can be written as 36/120 because it is 36 things out of 120 things. (In this case, the “things” are hundreds. I find this line of thinking makes much more sense than the idea of “canceling zeroes.”)
From there, one way to get to a denominator of 100 is in two more steps:
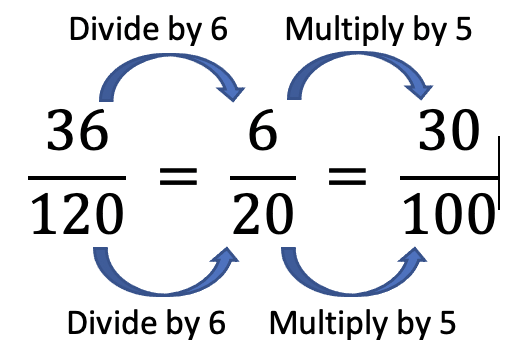
(There are lots of other ways to get to a denominator of 100. How many other ways can you think of? What do you think your students would be likely to do? Many students like to divide numerators and denominators by 2 — could that also be part of a path to a solution?)
I have heard people say that it is confusing or a waste of time to teach multiple approaches to a problem when it can be solved using one “simple” procedure. You may even hear this from your students. This is not really about teaching multiple approaches, though. Instead, by opening the conversation to multiple routes to the solution, you teach your students that they don’t have to be stuck with the one procedure that’s in the textbook. Nobody has to master every possible approach to a problem, but by exploring different approaches, students can grow into their own reasoning strengths and styles. It may be that the traditional textbook approach works best for some students, but the rest of us deserve a chance to find out what works best for us.
Sarah Lonberg-Lew has been teaching and tutoring math in one form or another since college. She has worked with students ranging in age from 7 to 70, but currently focuses on adult basic education and high school equivalency. Sarah’s work with the SABES Mathematics and Adult Numeracy Curriculum & Instruction PD Center at TERC includes developing and facilitating trainings and assisting programs with curriculum development. She is the treasurer for the Adult Numeracy Network.