Will This Be on the Test? (April 2021)
by Sarah Lonberg-Lew
Welcome to the latest installment of our monthly series, “Will This Be on the Test?” (You can find earlier installments as you scroll down the blog.) Each month, we’ll feature a new question similar to something adult learners might see on a high school equivalency test and a discussion of how one might go about tackling the problem conceptually.
Let’s dig into some data this month. What skills and understandings do you think of when you think of the data domain? There’s a lot more to it than calculating mean, median, and mode! Making sense of representations of data is important for not only the math section of the test but also for science and social studies. And on top of that, it’s one of the most useful numeracy skills for adults to have in the real world.
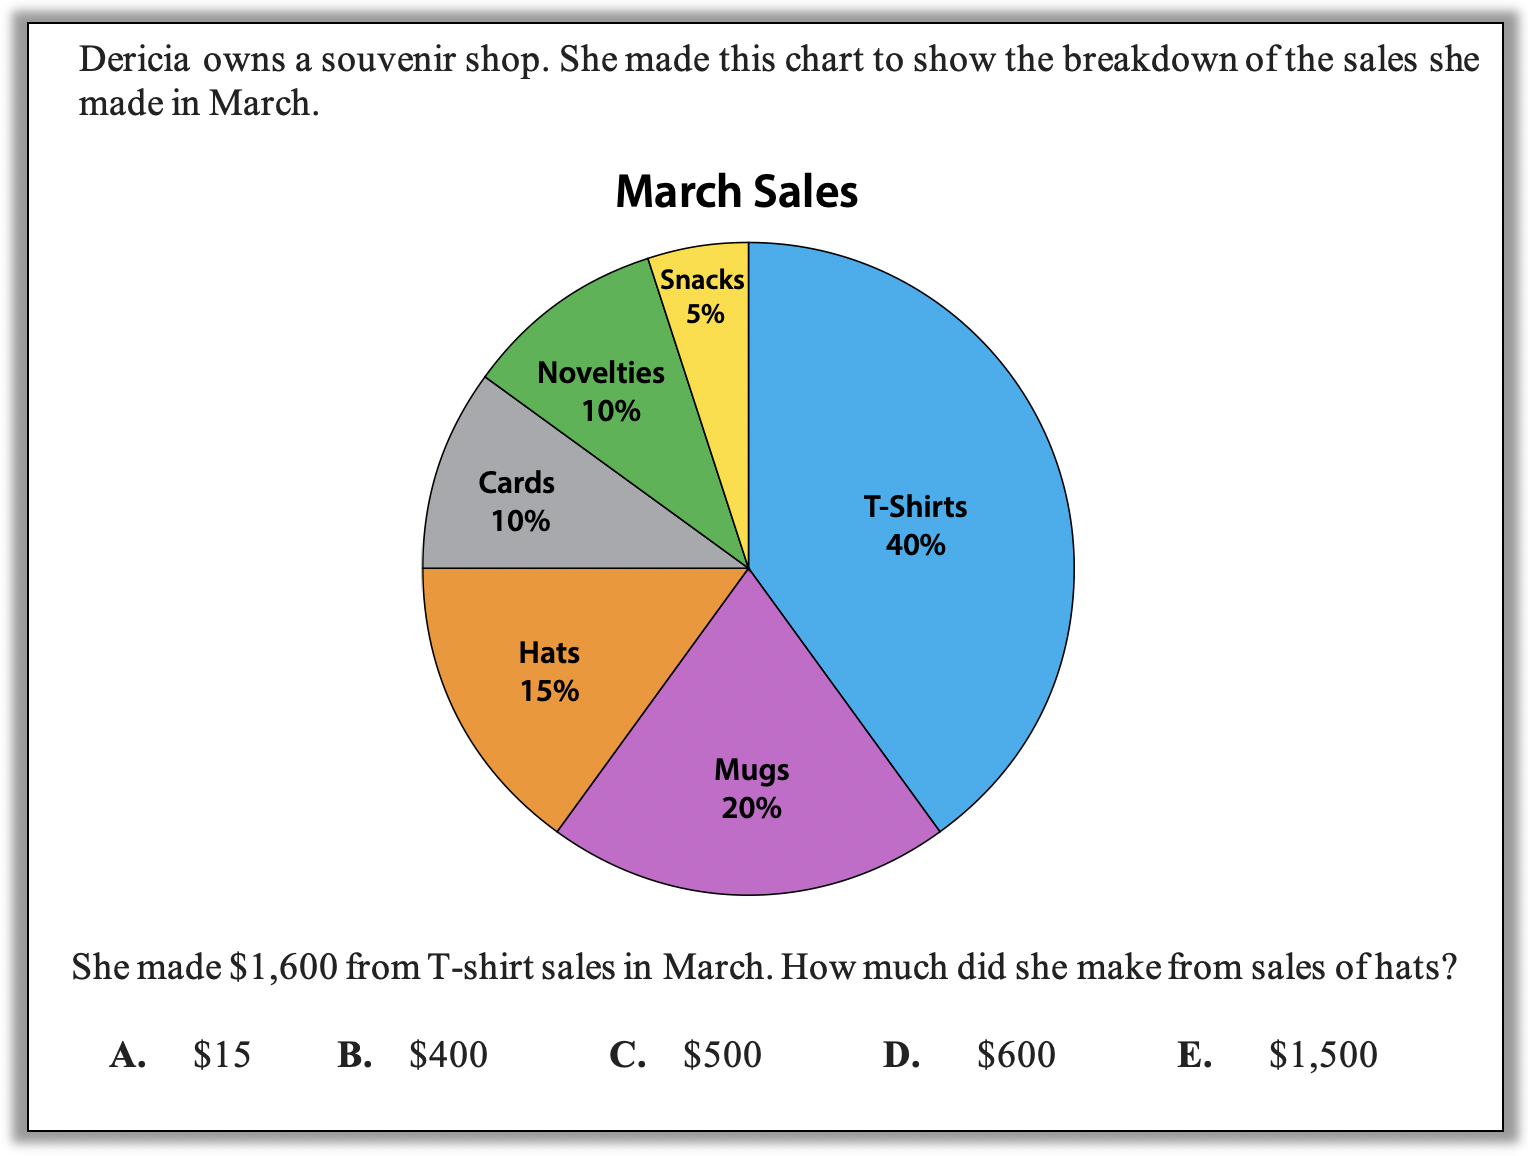
Here is this month’s challenge:
Before you read further, allow yourself to bring your full mathematical reasoning power to bear on this challenge. How many strategies can you think of? What visuals could you use to help you solve this? Also ask yourself, what skills and understandings do students really need to be able to answer this?
Before you read the possible approaches below, be aware that every single one of them relies on the important first step of understanding what the chart is telling you. If a student does not know how to read a circle graph, they will not be able to make sense of this task at all! It is essential to understand that each wedge of the circle graph tells what percentage of total sales came from each product. Even though we are inundated every day with representations of data, it is important not to assume students know how to make sense of them.
Here are some possible approaches:
1.Estimate! Look at the relative sizes of the wedges for T-shirts and hats. Seeing that the wedge for hats is smaller than the wedge for T-shirts won’t help much because that only tells a student that less money was made from hats than from T-shirts, and all the answer choices are less than $1,600. However, if a student fine-tunes their estimate a bit, they may make some progress. The wedge for hats appears to be a little less than half the size of the wedge for T-shirts. (Looking at the numbers confirms this – 15% is a little less than half of 40%.) Which answer choice(s) could reasonably be described as a little less than half of $1,600?
2.Find one percent from another. A student who has built a mental bank of benchmark percents and is comfortable comparing them to each other can figure out how much 15% of sales by starting with what they know about the 40%. There are a lot of different ways to do this, jumping from one benchmark to another. Here are a few possible paths:
(a) 40% >> 20% >> 5% >> 15%. Starting with 40%, a student might reason that half of that is 20%. We know 40% is worth $1,600, so half of that is worth $800. Therefore, 20% of the total sales is $800. From there, she could figure out 5% of the sales by dividing 20% by 4. $800 divided by 4 is $200. The last link in the chain is to get to 15% from 5%. How does 15% compare to 5%? What operation is needed?
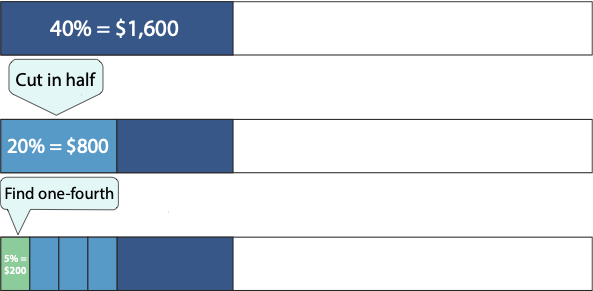
You can take the illustration from here. (Hint: How many blocks of 5% does it take to make 15%?)
(b) 40% >> 20% >> 100% >> 10% >> 15%. This chain starts with the same first step as the last one, but a student comfortable with the benchmark 20% might go from there to figuring out the total sales (the whole). If 20% of the whole is $800 (see reasoning path (a) above), then the total sales must be five times as much as that, or $4,000. From there, a common strategy for finding 15% of a number is to find 10% (or one-tenth) and then add on half of that. In other words, 10% + half of 10% = 15%.
(c) 40% >> 10% >> 15%. Combining ideas from the two chains of reasoning above, a student could jump from 40% to 10% by finding one-fourth of 40% by dividing 40% by 4. Then they could use the strategy of adding half of 10% on to 10% to get to 15%.
(d) Quite a few other possible paths! Students who understand the relationships between percents, fractions, and wholes can move around very flexibly in the world of percents. Starting from a benchmark of 50% (or ½ ) and building from there, students can get to a point where they can navigate to almost any percent with confidence.
3.Good old proportional reasoning. Percents are a special kind of ratio and therefore students can bring proportional reasoning tools to bear on them. As in the chains of moving from one percent to another above, there are several paths a student could take setting up proportions to get to the answer.
- Use the known percent to find the whole and then use the whole to find 15%. In our example, use one proportion to find the total sales, then use the total sales to find the $ made from hat sales:
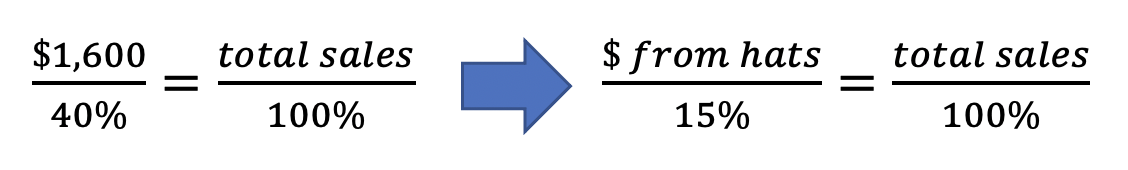
(Note: This is not the only way to set up these proportions to find the total sales and then the money earned from hat sales. And once the proportions are set up, there are many ways to reason about them!)
- A more direct path is to compare the known percent and the unknown percent in a proportion.

(Again, there is more than one possible way to set up and solve this proportion.)
Did you notice that reasoning about this data task involved a lot of number sense and proportional reasoning? One thing I love about the data domain is that it brings together elements of other domains in a concrete and applicable context. (Geometry is no stranger to the data domain either – representations of data use area and angles to show differences in the sizes of categories.) Teach data deeply and conceptually! We all need to understand it and it makes so many kinds of reasoning real and relevant.

Sarah Lonberg-Lew has been teaching and tutoring math in one form or another since college. She has worked with students ranging in age from 7 to 70, but currently focuses on adult basic education and high school equivalency. Sarah’s work with the SABES Mathematics and Adult Numeracy Curriculum & Instruction PD Center at TERC includes developing and facilitating trainings and assisting programs with curriculum development. She is the treasurer for the Adult Numeracy Network.