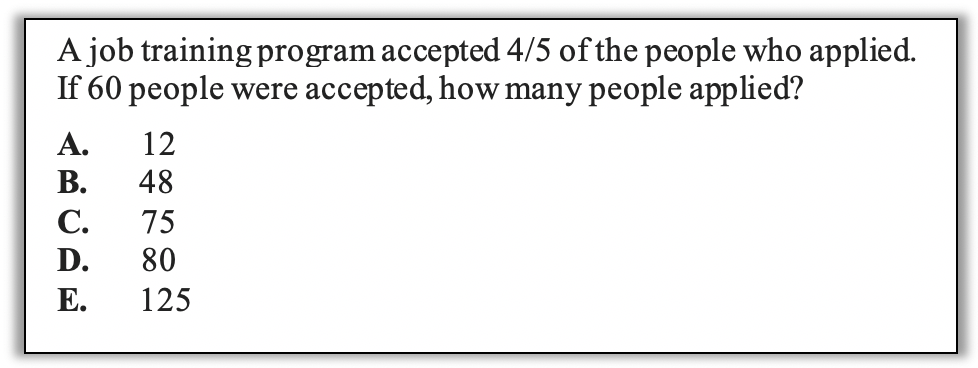
Will This Be on the Test? (November 2020)
by Sarah Lonberg-Lew
Welcome to the third installment of our monthly series, “Will This Be on the Test? (You can find earlier installments as you scroll down the blog.) Each month, we’ll feature a new question similar to something adult learners might see on a high school equivalency test and a discussion of how one might go about tackling the problem conceptually.
There are few topics that provoke anxiety and frustration in learners and teachers like fractions. Students are often carrying the weight of having tried to learn fractions operations so many times and never being able to remember the steps, let alone understand them. Teachers are often carrying a similar weight – how many times can you go over those same procedures? Why do you have to keep reteaching this topic? It’s tempting to spend one or two class periods teaching students how to do fraction operations on a calculator and be done with it. After all, students are allowed to use calculators on most HSE tests.
With that in mind, here is this month’s problem:

Before you read further, take a few minutes to challenge yourself to come up with more than one way to approach this task. How many strategies can you think of? What visuals could you use to help you solve this? Also ask yourself, what skills and understandings do students really need to be able to answer this? To what extent, if at all, are memorized procedures required? Would a calculator be helpful here? (For a bonus challenge, try to find the “attractive distractors” in the answer choices. What mistaken strategies might students pursue that would lead them to these incorrect answers?)
Before you read further, take a few minutes to challenge yourself to come up with more than one way to approach this task. How many strategies can you think of? What visuals could you use to help you solve this? Also ask yourself, what skills and understandings do students really need to be able to answer this? To what extent, if at all, are memorized procedures required? Would a calculator be helpful here? (For a bonus challenge, try to find the “attractive distractors” in the answer choices. What mistaken strategies might students pursue that would lead them to these incorrect answers?)
When you’ve given yourself enough time to really explore, read on to see some possible ways students might approach this problem using conceptual understanding and visuals.
1.Estimate! A student who takes the time to make sense of this problem and think about which answers are reasonable will quickly narrow the possibilities down to two answer choices. It takes a little time and effort to figure out the relationships in this problem, but it’s worth it. A student might do a quick sketch of the fraction in the problem and use it to figure out what they have and what they are looking for:
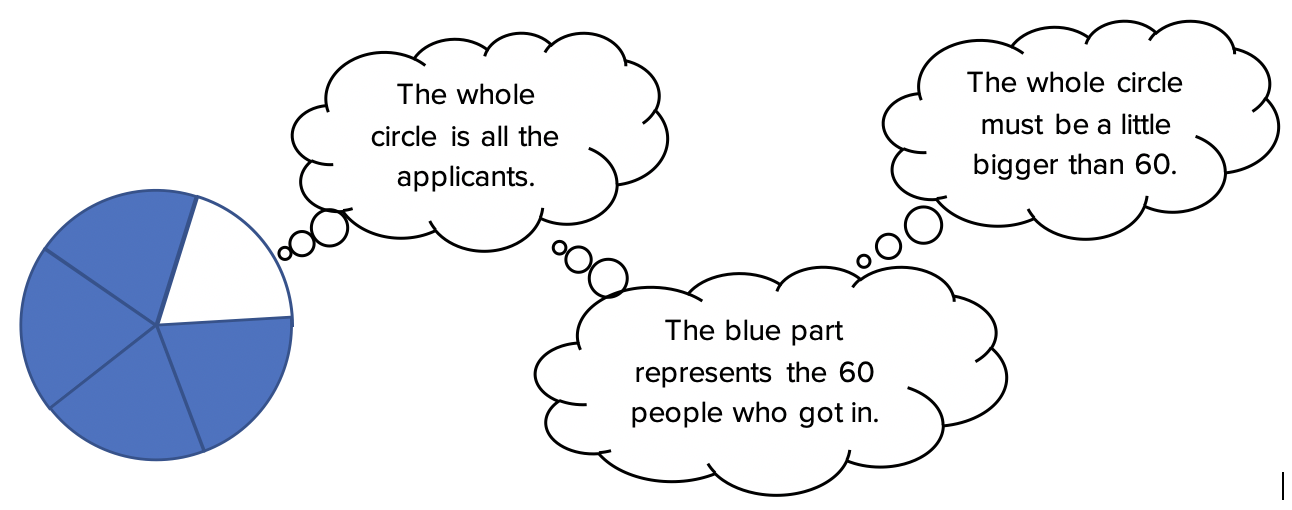
Three of the answer choices are bigger than 60, but answer choice E is more than twice as big and the sketch shows that the whole circle is only a little bit bigger than the shaded part, so the answer must be C or D.
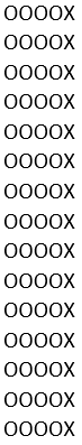
2.Think about and draw ratios. A student might interpret the fact that 4/5 of the applicants were accepted as meaning that four out of every five applicants were accepted. In other words, for every four that got in, one did not. A student might try drawing all the applicants. Using quick symbols, it doesn’t take as long as you might think. How many Xs and Os are in the picture? A student could count them one at a time, count by fives, or think of this as an array and multiply the dimensions.
It’s also possible that after drawing the first few sets, a student might start to see some patterns and regularity and ask themself, “How many of these will I have to draw?” Since the student already knows that there are five “people” in each row, answering that question will be a quick way to get to the total. (Here is a an example of when a calculator might be helpful. Since there are four accepted people in each row, and 60 accepted people total, the number of rows can be found by dividing 60 by 4. Then the total can be found by multiplying the number of rows by 5. Calculators, used judiciously, can help students use their time well and stay focused in test situations.)
3.Draw a Singapore strip diagram (also called a bar model). Singapore strips are great for making sense of parts and wholes. If students are comfortable drawing and reasoning with them, they provide a way of making sense of the structure of the problem that makes answering the question fairly intuitive.
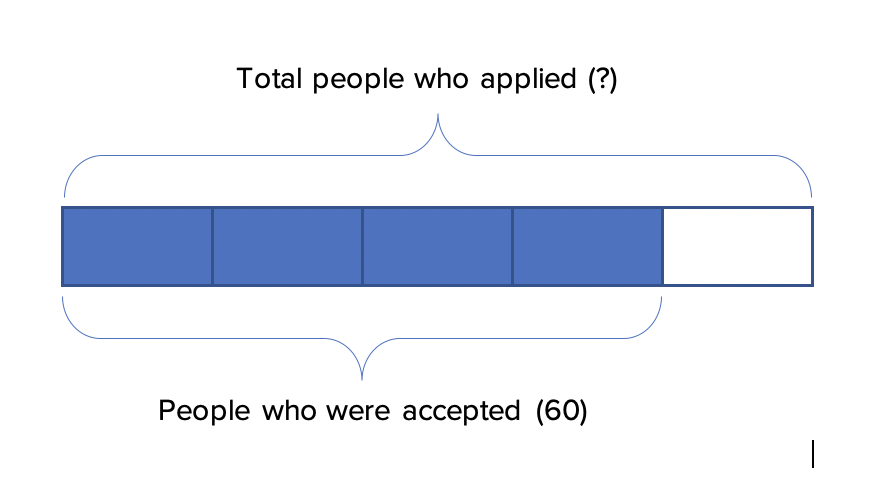
To solve this problem with the diagram, a student would figure out how many people each box represents. (Four boxes represent 60 people, so how many people are represented by a single box?) Since the total number of people who applied is represented by the whole bar or five boxes, once a student knows how many people each box stands for, they will be able to find the whole in just one more step. (For a similar example using a model like this, see our blog, “How I Learned to Stop Worrying and Love Percents”.)
What about the calculator?
What did you decide about the usefulness of a calculator in addressing this month’s problem? What would your students do? Solve the problem without a calculator? Use a calculator judiciously for some quick computations? Grab the calculator and start doing whatever fraction operations they can think of? A calculator can be a great tool when used strategically, but only teaching students how to do fraction operations procedures instead of teaching how to reason about fractions will not serve them as well on the test or in life.

Sarah Lonberg-Lew has been teaching and tutoring math in one form or another since college. She has worked with students ranging in age from 7 to 70, but currently focuses on adult basic education and high school equivalency. Sarah’s work with the SABES Mathematics and Adult Numeracy Curriculum & Instruction PD Center at TERC includes developing and facilitating trainings and assisting programs with curriculum development. She is the treasurer for the Adult Numeracy Network.