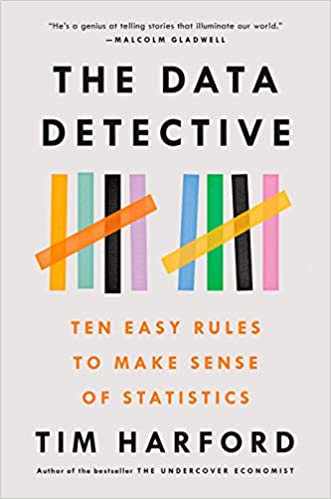
Special Summer 2021 Edition: Book Review of The Data Detective
by Melissa Braaten

There are three kinds of lies: lies, damned lies, and statistics.
–Everyone and no one
The quote above is so well-known that, like many popular sayings, it’s been attributed to a number of different people, and we don’t really know who used it first.1 How do you respond to hearing that quote? In his new book, The Data Detective: Ten Easy Rules to Make Sense of Statistics, Tim Harford attempts to unpack our cultural cynicism towards statistics and see if we can move towards a more productive attitude of curiosity and truth-seeking.
I’ve seen this mistrust toward data and statistics in quite a few teachers. Perhaps some of this mistrust comes from well-known problems with one of the most common forms of data collected in education: standardized testing. Perhaps it is the tedium of data collection and reporting that we have to do in our jobs, or our fear of reducing our students to numbers. Perhaps it is a symptom of a general cultural wariness of “big data”; we know that data is being collected about us as we search and shop online and used in ways that are not always transparent.
Or perhaps, as Harford suggests, it is a legacy of Darrell Huff’s How to Lie with Statistics – a best selling book, first published in 1954, that illustrates a number of common ways that statistics and data can be used to manipulate and mislead. In Harford’s new book, he opens by examining his own history as a “statistics debunker.” It was fun, but he has grown concerned. As a culture, Harford feels we have moved from a healthy, questioning skepticism towards statistics to a cynicism that dismisses the very real power they have to help make life or death decisions. Harford uses the example of British researchers Richard Doll and Austin Bradford Hill (two of Huff’s contemporaries) who were the first to use data and statistics to convincingly demonstrate that cigarettes cause lung cancer. Doll and Hill spent years collecting large sets of data to show that cigarette smoking made a person, statistically speaking, sixteen times as likely to develop lung cancer. Can statistics be used to obscure the truth? Yes. But what Harford points out with this example is that they can also be used to reveal truths that might not be able to be seen any other way.
What does responsible data skepticism look like? In the introduction to his book, Harford writes,
“If we give in to a sense that we no longer have the power to figure out what’s true, then we’ve abandoned a vital tool. It’s a tool that showed us that cigarettes are deadly. It’s our only real chance of finding our way through the coronavirus crisis – or more broadly, understanding the complex world in which we live… Of course, we shouldn’t be credulous – but the antidote to credulity isn’t to believe nothing, but to have the confidence to assess information with curiosity and a healthy skepticism.”
That certainly sounds like the type of data literacy I would like to have! It’s the kind I’d like to pass on to my students as well.
Harford is a popular author, and he writes for the non-statistician. His book is full of current and historical anecdotes, rather than numbers, although he clearly explains how these events illustrate the larger point. He discusses the real and cultural phenomenon of “fake news.” He uses the example of a successful art forger to show how our emotions can influence our interpretation of facts. He uses an example of how different hospitals recorded late miscarriages that affected our views of infant mortality. While his “ten easy rules to make sense of statistics” are mostly things to watch out for, it is not because he thinks all the statistics out there are meant to mislead us. Instead, they are habits of mind, or disciplines, to help us make the best use of a powerful and life-saving tool.
Harford’s Rule Two is to “Ponder Your Personal Experience.” This stuck with me. In this chapter, he is contrasting two views of reality: what he calls the “worm’s-eye-view,” which is the detailed, visceral understanding we have from our own experience, and the “bird’s-eye-view,” the generalized, abstracted description offered by statistics. He illustrates the two views using the example of his experience riding the London subway system. Though his own commute is busy and uncomfortably crowded, published statistics claim that the average occupancy of the train is less than 130 people, which would mean only a handful of people in each car. How can he reconcile his experience with these numbers? Harford points out that both the worm- and the bird’s-eye-view can be true at the same time, and together they provide a more complete picture of reality. As a commuter, he has a more intimate knowledge of the crowding on his route, but he is not aware of the trains on the other side of the city that run almost empty. Looking only at the statistics, Harford’s experience is lost.
As a teacher, I have a worm’s-eye-view of my students: day-by-day, detailed, relational knowledge about their learning, their lives, what seems to work and what doesn’t. But I can also get lost if I assume that all other adult students are like mine. Many aren’t. My program primarily serves immigrants, and our students tend to be older than average. We also specialize in students at early literacy levels. Other programs that serve recently out-of-school youth might find that their students’ learning, lives, and needs are very different from those of mine. So while the statistics we collect about adult education students across the state encompass more data and variation, they can lose some of the detail and the human connection needed to think about how a policy might affect people. Both views might be correct, yet both have limitations. Harford makes a good case for bringing together data from different perspectives, both zoomed-in and zoomed-out, to help us have the best possible understanding of our complicated world.
Admittedly, I like reading popular math books, so the fact that I found this an enjoyable read is not surprising. However, Harford’s accessibility, and the fact that he uses so many current and relatable examples to illustrate his points, makes this a valuable book for anyone who is willing to examine their own preconceptions about data and statistics. This book could help teachers take a clear-eyed look at the role that data and statistics play in our lives, and value teaching them rigorously to help our students appreciate and use, rather than dismiss, these powerful tools.

Melissa Braaten is an adult education instructor at Catholic Charities Haitian Multi-Services Center in Dorchester, MA. Melissa has taught ASE and pre-ASE math and reading, as well as ABE writing, computer skills, and health classes. Melissa also is a training and curriculum development specialist for the SABES Mathematics and Adult Numeracy Curriculum & Instruction PD Center at TERC. She has written several articles for Math Musings, the Adult Numeracy blog.
