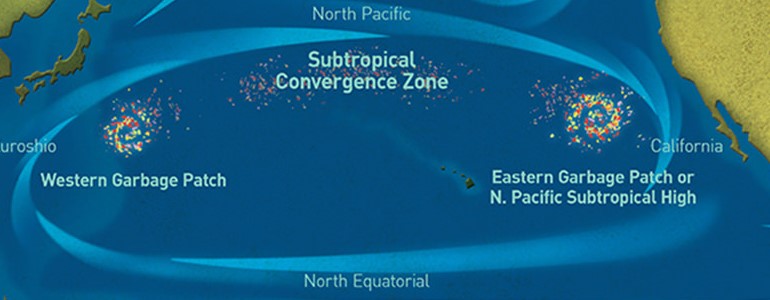
“Over a lifetime, each American throws away nearly 15 tons of packaging. Much of this ends up in the oceans, and much of it is plastic. As plastic ages it breaks into pieces called ‘nurdles’ or ‘mermaid tears.’ These pieces make their way into the food chain and can sicken or kill wildlife.”
National Geographic’s The Perils of Plastic webpage contains a lesson in which students collect their clean recyclable trash for one week and use what they learn about how much trash they generate to estimate how much they would generate over one year or ten years. This is meant to be done as a class, but it could also be done remotely with students calculating their own or their family’s impact at home.
This could be extended to making sense of the statistics about the Great Pacific Garbage Patch found at The Ocean Cleanup website. That site includes a video that explains how the statistics were arrived at using sampling and surveying.
In a math class, this information could be tied into lessons on proportional reasoning, area, weight, volume, and data. They could also be incorporated into lessons in other subjects such as geography and environmental sciences.
Some ideas for sample math units/lessons:
- Lesson 2 It’s a Lot of Work from the EMPower™ title Keeping Things in Proportion provides further experience with using samples to make estimates – students time themselves doing a small sample of a large job to draw conclusions about how long the whole job would take.
- Two math activities from PBS LearningMedia on using samples to make estimates about population could be connected to the idea of using a sample of students’ recyclables to estimate their impact over time:
- An activity on sampling using fish tagging to estimate the number of fish in a pond.
- An interactive that uses sampling to estimate the number of penguins in a region. (Note that all students do in this interactive is click buttons and the simulation does all the work, so teachers might want to build some guidance around it.)
Other supporting resources on the topic include:
- The Story of Plastic video at the Story of Stuff Project provides a bigger picture view of how we end up with so much plastic globally.
- The Garbage Patches webpage at the Marine Debris Program at the National Oceanographic and Atmospheric Administration (NOAA). This page contains detailed information about garbage patches including links to helpful resources like:
- A two-minute video on garbage patches
- A fact sheet on garbage patches
- Curriculum resources at the Marine Debris Program at the National Oceanographic and Atmospheric Administration (NOAA). Activities and curricula about marine debris, including Turning the Tide on Trash contains three units on marine debris with lessons at multiple levels. Interesting tables and graphs can be found in the lessons.
