Integrating Statistics in the Content Areas
This post originally appeared in the December 2018 edition of Reflect & Connect: The Reflective Practitioner, managed by our colleagues at the SABES ELA Center. This is a companion blog post to “The Case for Statistical Literacy Across Content Areas”.
by Melissa Braaten
Interested in incorporating statistics into your content classes, but not sure what this might look like in practice?
There are ways to get students involved with collecting and interpreting their own data, as well as lots of room for making use of available data to enrich your content classes—and your students’ statistical literacy!
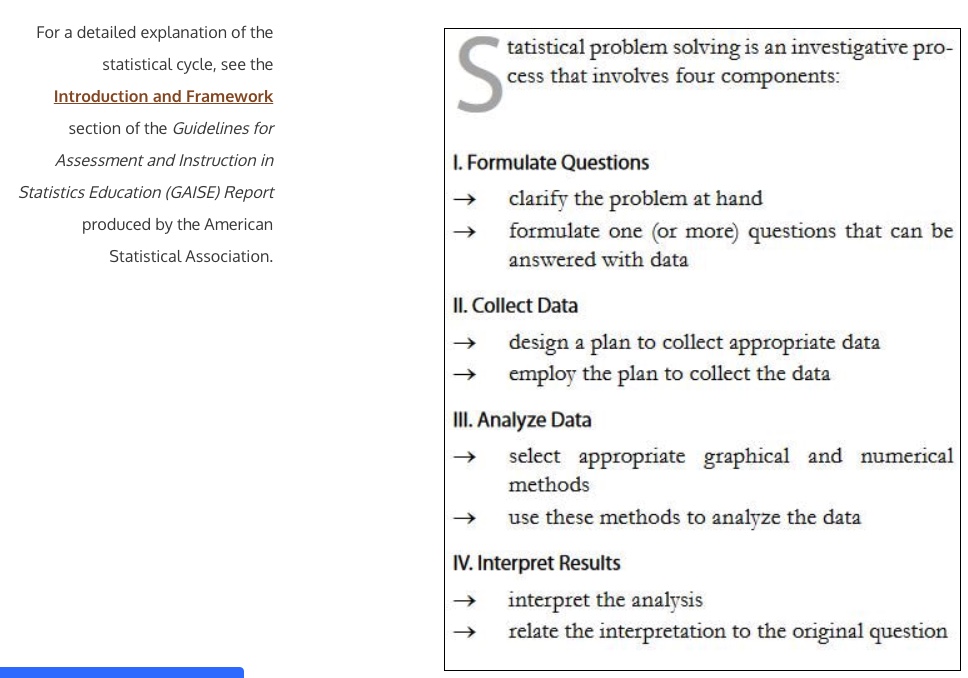
Giving Students Experience with the Statistical Cycle
I recently had the opportunity to work with a class in which I taught the math, ELA, science, and social studies content. I decided to invest a lot of energy early on talking about statistics and data, in hopes that this would lay a foundation for later work in social studies and science.
Frequently, math instruction in statistics focuses only on data analysis—that is, reading and creating graphs and learning how to calculate measures of central tendency, such as mean, median, and mode. While these are certainly important, the scope needs to be much broader to help students become truly “statistically literate.”
I started the unit by exploring the statistical cycle in its entirety: posing a question, deciding on and executing a plan to collect data, analyzing the data, and finally reflecting on the results to see if they do, in fact, answer the question, and with what degree of confidence.
We undertook our own survey project in which students designed a survey to collect data that they felt would be useful for the staff of our adult education program. They debated different wordings of questions and discussed the best way to distribute and collect the surveys.
All along, the students took a very active role. They decided they could get more responses if they offered the survey in English, Spanish, and Haitian Creole, so volunteers stepped up to translate. Other students went into classrooms one at a time to distribute, explain, and collect the surveys.
After the surveys were collected, groups of students discussed ways to tabulate the data (while I encouraged them to come to a consensus about how they would deal with irregular or unexpected responses). They then created several types of graphs and compared what impact each type of graph had on the impression the viewer had of the data. Finally, they had to decide to what extent they had answered the original question.
In many cases, they found that their original wording did not quite give them the answers they wanted (piloting questions first can be helpful in understanding how they will be interpreted!), or that they may have needed a larger sample to feel more confident. While my students may not have changed the world with this project, they certainly got an authentic experience of what data collection and analysis is really like.

Data and Statistics in Science
Later in the year, we studied scientific methods and ran our own experiment to determine the effect of material on distance: how the type of paper an airplane is made of affects the distance that airplane will fly. The steps typically associated with scientific methods closely mimic that of the statistical cycle, and students seemed to grasp the idea fairly quickly.
While conducting the experiment, the messiness of real data collection showed up again: some of the airplanes hit people or objects, and they had to decide what to do with those trials. They discovered that two different people timing the same event on their phones will be off by a little bit—how do they deal with that? Was it okay to open the window in the room, or would that affect the “flying conditions”? My students had a lot of fun with this project and did a great job discussing and working through the challenges that arose.
The statistical method (and the classic “controlled experiment”) are a great place to explore data and statistics, but this is not the only way data is used in the sciences.
In an upcoming unit on the human body, I am going to teach a lesson on vaccines. Students will hear arguments on both sides of the childhood vaccine debate and will also look at data showing the rates of smallpox in different countries over time, comparing before and after vaccines were available as well as before and after they were made mandatory.

Looking at data collection in the context of health care will be interesting, as controlled experiments are not always possible for ethical reasons. For example, we cannot ethically assign children to not receive vaccines, since there is evidence that unvaccinated children are at a higher risk of contracting certain diseases.
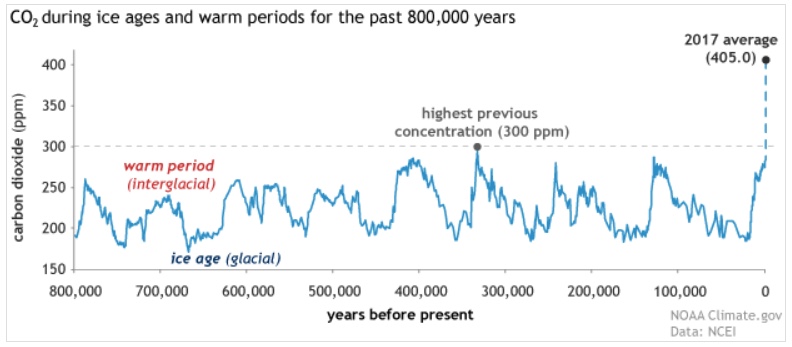
Later on, I will be teaching a unit on climate and climate change, which presents another challenge for data collection: how do you run a controlled experiment on a system as large and complicated as a planet, with changes that take place over a long period of time? When we look at how climate scientists collect and interpret data, we will see them taking advantage of “natural experiments,” such as climate information before and after the Industrial Revolution, when human production of CO2 increased dramatically.
Data and Statistics in Social Studies
The study of history relies on a lot of quantitative data, but also presents its own set of challenges for statistical analysis. We can’t go back in time to collect data that no one recorded, so historians sometimes have to use other types of data as a proxy. For example, a historian might use voter registration rates to make inferences about political participation, or school enrollment numbers to make inferences about education and literacy levels.
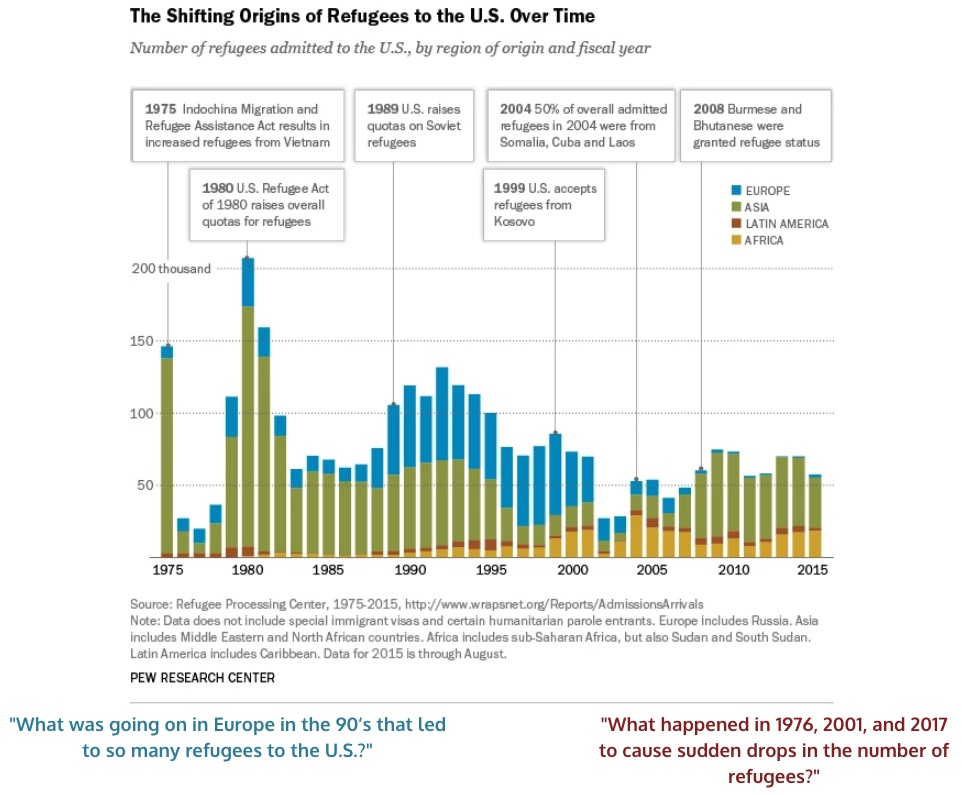
Raw historical data can also help generate questions. In an upcoming unit on U.S. immigration, I will have students look at a graph of U.S. refugees over time, which shows not only the total numbers, but also breaks the total down by continent of origin. Looking closely at the graph should generate some questions about what was happening in the world at different points in time, such as What was going on in Europe in the 90’s that led to so many refugees to the U.S.? What happened in 1976, 2001, and 2017 to cause sudden drops in the number of refugees? Looking at data can get students curious, since data never tell the full story.
Some Techniques for Presenting Data
When presenting data or statistics that students have not generated themselves, how the data are presented can make a different in student engagement. Two techniques I use a lot are notice/wonder and graph reveals.
In notice/wonder, you give students time to make observations about a piece of data, asking “What do you notice?” I usually ask them to write down two or three observations. There are no wrong answers. Then I ask them “What do you wonder?” and have them generate two or three questions that come to mind about the data. This can work to introduce a piece of data, or even to spark an investigation, if students want to try to answer some of their questions.
When I find an interesting graph, I often combine notice/wonder with a graph reveal. In a graph reveal, I create a slideshow that starts with a version of the graph without any labels or context. I ask students what they notice and wonder, and what information they would like to have. Each slide adds a little more to the graph (scales, axes labels, and last of all, a title). At each stage we do a quick notice/wonder. This works well for very complex, rich data displays since students don’t have to process all the elements at once, and creates a lot of interest because they want to know if their predictions are correct. (I originally encountered this idea on the blog Teaching to the Beat of a Different Drummer, in a post titled “Trick or Treat!”)
If you are interested in learning more about how to incorporate statistical literacy into your adult education classroom, check out the SABES website for some upcoming courses on data and statistics from the SABES Mathematics and Adult Numeracy Curriculum & Instruction PD Center. This is a topic that deserves a place in every content area, not just the math classroom.
===============================================================
Melissa Braaten is an adult education instructor at Catholic Charities Haitian Multi-Services Center in Dorchester, MA. Melissa has taught ASE and pre-ASE math and reading, as well as ABE writing, computer skills, and health classes. Melissa also is a training and curriculum development specialist for the SABES Mathematics and Adult Numeracy Curriculum & Instruction PD Center at TERC. She has written several articles for Math Musings, the Adult Numeracy blog.