A Chance to Change
by Lakshmi Nayak
A friend with diabetes recently told me,
“If you don’t have a health threat in your life, it’s difficult to make changes. If you are diagnosed with diabetes it’s easier to make changes because the threat, and the need, is right in front of you. But if you are pre-diabetic or have family members with diabetes, you have a chance to change your lifestyle before you get irreversible diabetes. Think of pre-diabetes (or having high risk factors) as a chance to change.”
If you actually have diabetes, like this friend, then you know you have to track your blood sugar levels, and count carbs and calories, and daily activity levels, and keep track, overall, of weight. There’s a lot of basic math involved, such as units of measurement, quantities and comparisons, addition and subtraction, percentages, graphs and charts. None of it is theoretical—all of it ties into how you are feeling, and has very real consequences for your health.
I looked at the risk factors (risk: another math concept!) in the American Diabetes Association’s Risk Test, and only two of them put me into their high risk category: my age, about which I can do nothing, and my weight, which… sigh. Like many Americans, I can stand to lose a little. But I’m also tired of what I perceive as the American obsession with weight, and I hate dieting and formally exercising. I really don’t want to get to a place where I have to count carbs and calories. (Race is also a risk factor, but that’s another story.)
The Harvard T.H. Chan School of Public Health agrees with me about calories: “In practice, it’s hard for people to track the amount of calories they take in each day. A better approach: Adopt habits that will help you avoid overeating… and skip some of the high-calorie, low-nutrient foods that are most strongly linked to weight gain, such as sugar-sweetened beverages, refined grains, and potatoes.” (https://www.hsph.harvard.edu/obesity-prevention-source/diet-lifestyle-to-prevent-obesity/)
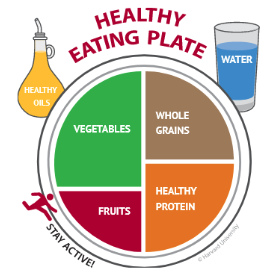
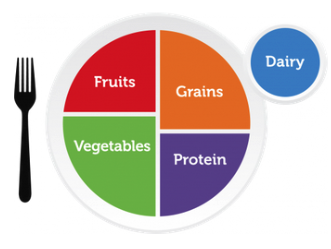
Harvard has created the Healthy Eating Plate, a variation on the federal MyPlate. Both offer opportunities for exploring benchmark fractions, and for visual representations of data.
(translation available in Spanish)
It would also be interesting to compare and contrast both plates; to make plate graphs for both; and to weigh amounts of food and sizes of plates – thinking of the various ways that we can measure and quantify our food, and how each makes a difference.
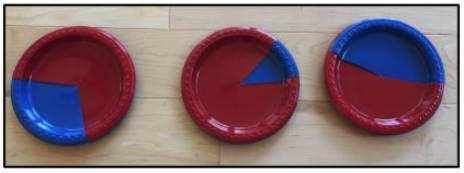
To make literal plate graphs*,
1. Get two different colors of paper or plastic plates.
2. Use scissors to cut the radius of one plate of each color.
3. Slip one plate onto the other, by overlapping the radius of each.
4. Rotate one plate over the other to show the fractional data.
Interestingly, one of my aunts has the opposite problem to me: she needs to gain weight. She can’t just do the opposite of these guidelines, though, and consume sugary drinks and unhealthy fats, as she needs the nutrients and not just empty calories. It’s been fascinating watching her at first track how many grams of salt or fluid ounces of water or tablespoons of healthy oil she was using across a day (she has a kitchen scale and measuring cups and spoons, so she can measure by weight or by volume), moving on to inserting small snacks throughout her day, and noticing if and when her appetite increases. She also exercises as much as her stamina allows. Again, lots of opportunities for working with units of measurements, charts and tables, and graphs.
Whether you or your adult learners are trying to gain weight, lose weight, maintain weight, decrease the chances of futures diseases, build up bone density, have more energy, or something else, positive benefits will result from thinking about what you eat, when you eat, how you eat, and your activity levels, all in the least annoying way to you. Go use some math, and be healthy.
Want to learn about other ways to connect math to topics like health, climate change, and gender pay gap? See our collection of Cross-Discipline Resources here.
Lakshmi Nayak has been involved with adult basic education for many years: as a coach with the national Standards-in-Action 2.0 project, sponsored by OCTAE; as the coordinator of the SABES ELA C&I PD Center for seven years; and as a teacher and tutor. She has taught Science to ASE students at the Cambridge Community Learning Center, all subjects to ASE and pre-ASE students at Project Hope in Boston, and tutored GED students at Bridge Over Troubled Waters in Boston. She loves encouraging curiosity, helping people to connect the dots and experience Aha! moments, whether in a science or social studies class or in a PD session. Lakshmi earned a Master’s Degree in education through a joint program between Tufts University and the Shady Hill Teacher Training Course.